Fig. 4.
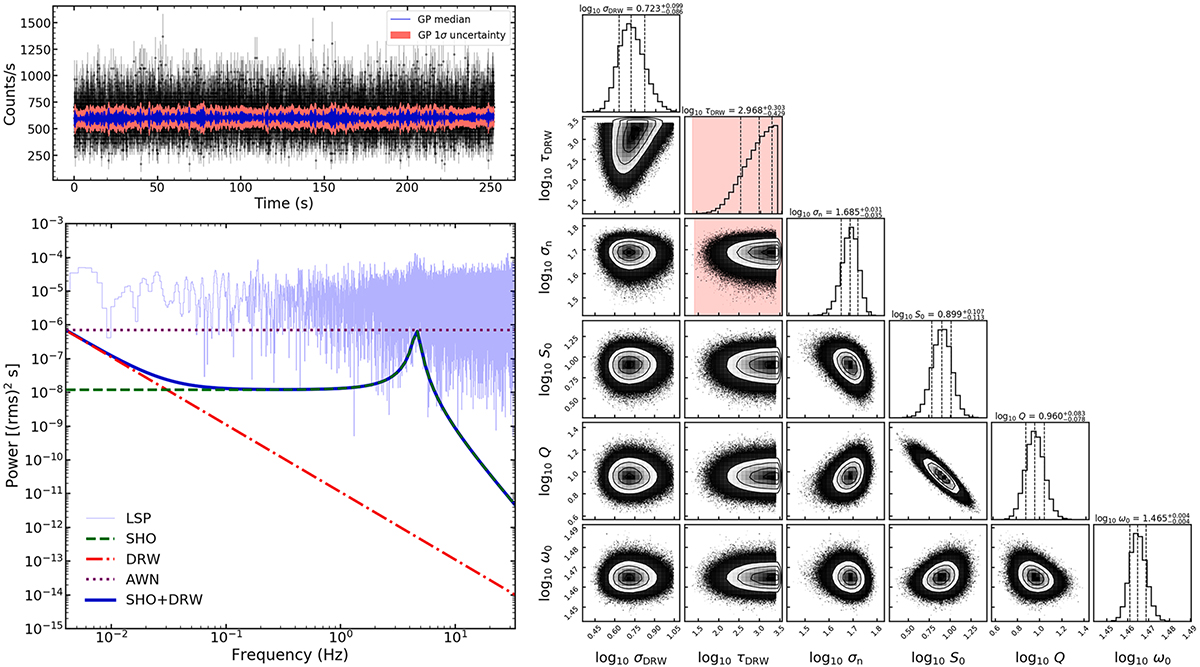
Download original image
HE fitting results when Q is free. Left column, from top to bottom: Light curve fitting results (including the mean prediction from the GP model and the 1σ uncertainty range corresponding to the total kernel) and PSD. Right column: Parameter corner plot. The ME fitting results are similar to the HE results, which are not shown. For both HE and ME, τDRW is not effectively constrained.
Current usage metrics show cumulative count of Article Views (full-text article views including HTML views, PDF and ePub downloads, according to the available data) and Abstracts Views on Vision4Press platform.
Data correspond to usage on the plateform after 2015. The current usage metrics is available 48-96 hours after online publication and is updated daily on week days.
Initial download of the metrics may take a while.