Fig. 6.
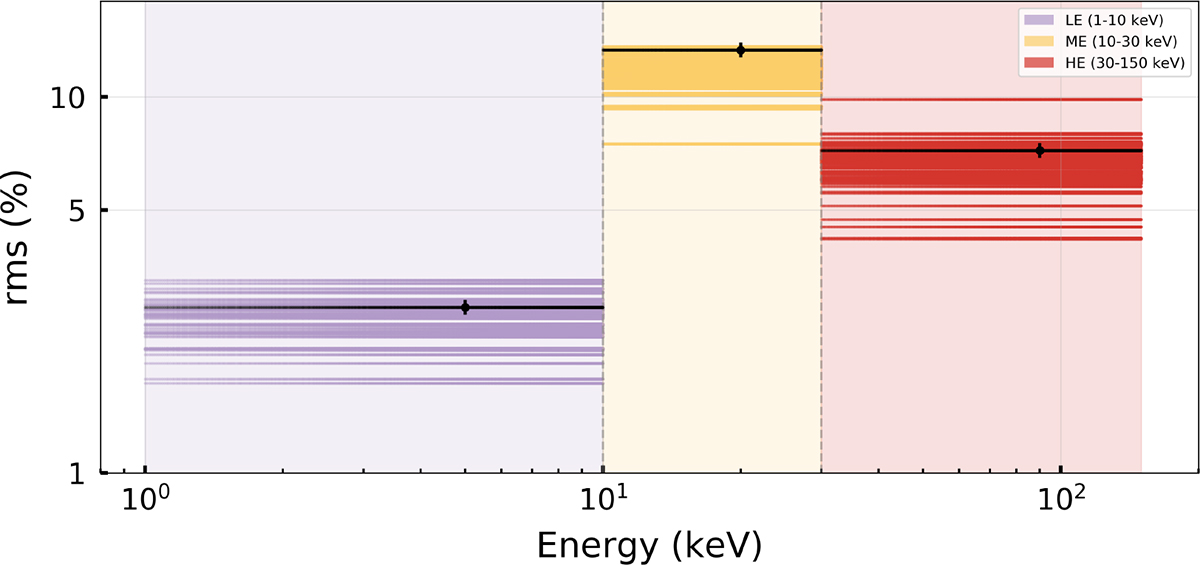
Download original image
Fractional rms of the three energy bands (LE, ME, and HE), calculated by dividing the standard deviation of the SHO term by the mean count rate. The colors (purple, yellow, and red) correspond to the three discrete energy bands, with each line indicating the rms value for that GTI within the respective band. The three black lines correspond to the fractional rms of a representative ExpID calculated using the frequency-domain method.
Current usage metrics show cumulative count of Article Views (full-text article views including HTML views, PDF and ePub downloads, according to the available data) and Abstracts Views on Vision4Press platform.
Data correspond to usage on the plateform after 2015. The current usage metrics is available 48-96 hours after online publication and is updated daily on week days.
Initial download of the metrics may take a while.