Fig. 11.
Download original image
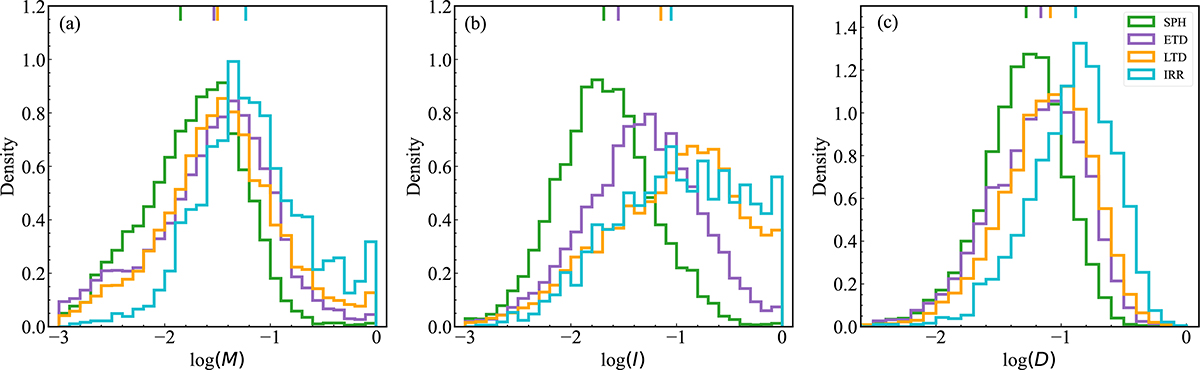
Histogram distributions of multimode (M, panel a), intensity (I, panel b), and deviation (D, panel c) for different types of massive galaxies. Color bars at the top of each panel show the median values of M, I, and D for each galaxy type. Notably, the MID median values gradually increase from SPH to IRR types, reflecting a systematic trend of different galaxy types in the MID parameter space.
Current usage metrics show cumulative count of Article Views (full-text article views including HTML views, PDF and ePub downloads, according to the available data) and Abstracts Views on Vision4Press platform.
Data correspond to usage on the plateform after 2015. The current usage metrics is available 48-96 hours after online publication and is updated daily on week days.
Initial download of the metrics may take a while.