Fig. 7.
Download original image
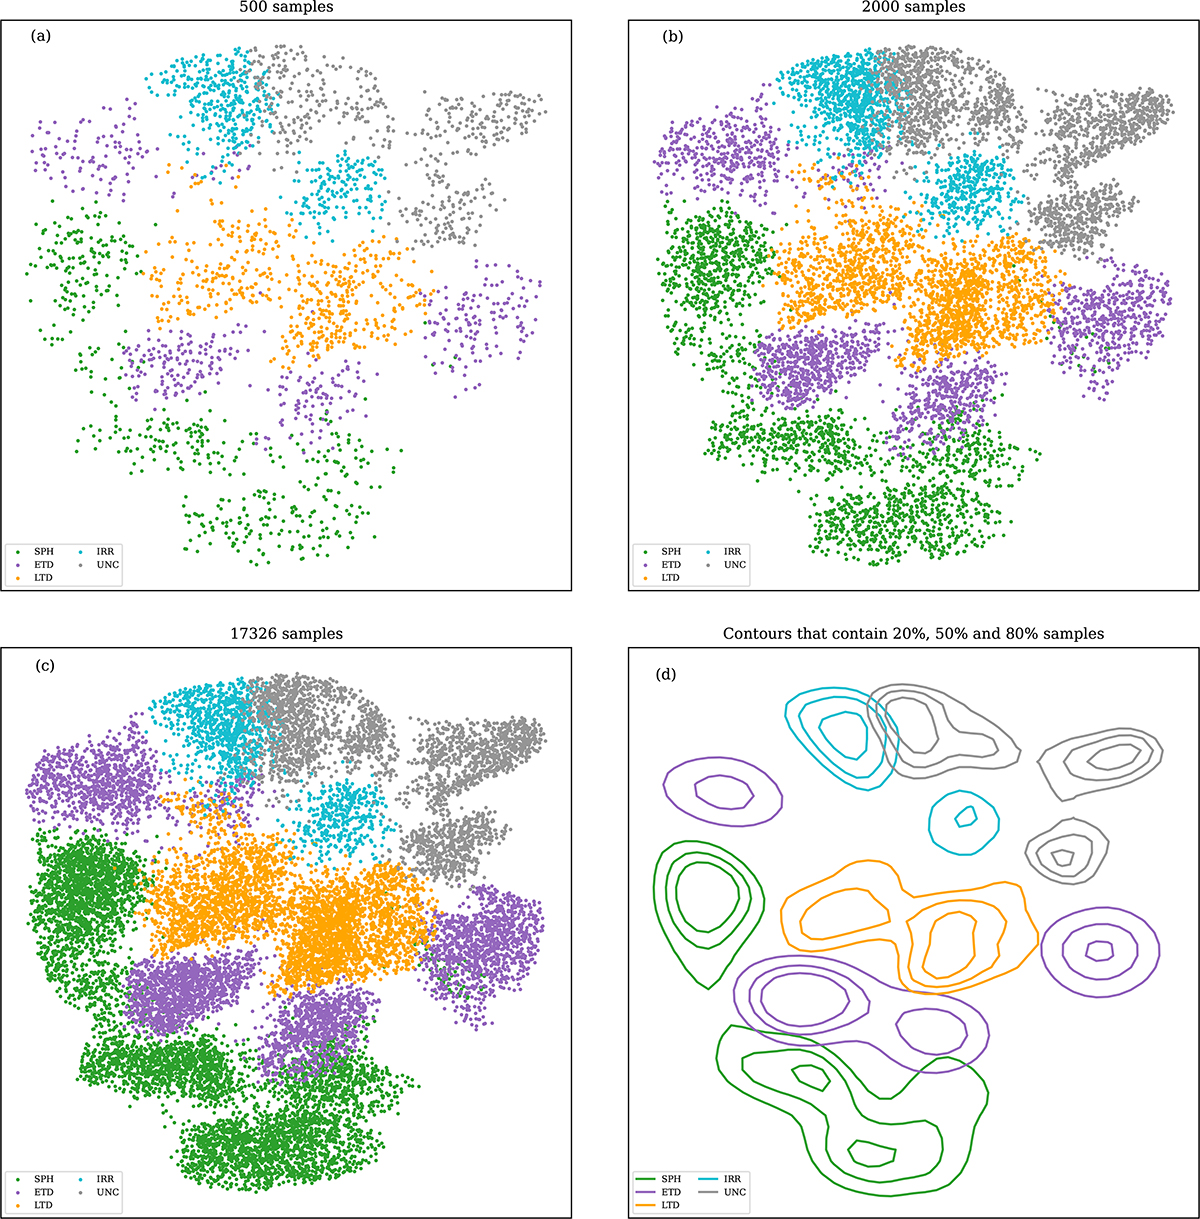
Visualization of the final classification results using UMAP. The UMAP dimensionality reduction technique projects the five classified galaxy types into a two-dimensional space. Panel (a) shows the dimensionality reduction results for a random subset of 500 samples, panel (b) for 2000 samples, and panel (c) for the entire dataset. The contours in panel (d) enclose 20%, 50%, and 80% of the corresponding samples.
Current usage metrics show cumulative count of Article Views (full-text article views including HTML views, PDF and ePub downloads, according to the available data) and Abstracts Views on Vision4Press platform.
Data correspond to usage on the plateform after 2015. The current usage metrics is available 48-96 hours after online publication and is updated daily on week days.
Initial download of the metrics may take a while.