Fig. 8.
Download original image
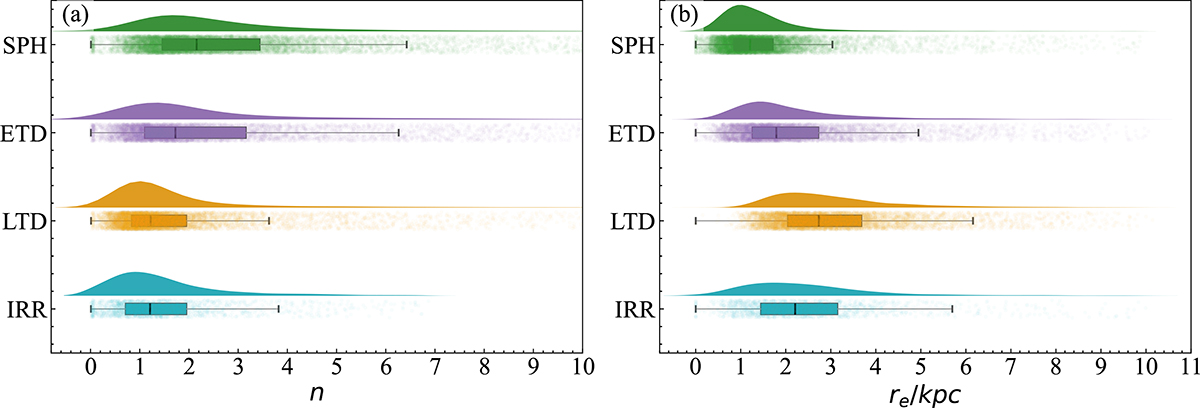
Raincloud plots for different types of massive galaxies: Sérsic index (left) and effective radius (right). “Cloud” sections show kernel density distributions, while “rain” parts show individual value distributions. In the box plots, bounds denote the first and third quartiles, the central line marks the median, and the whiskers indicate the minimum and maximum values.
Current usage metrics show cumulative count of Article Views (full-text article views including HTML views, PDF and ePub downloads, according to the available data) and Abstracts Views on Vision4Press platform.
Data correspond to usage on the plateform after 2015. The current usage metrics is available 48-96 hours after online publication and is updated daily on week days.
Initial download of the metrics may take a while.