Fig. 5.
Download original image
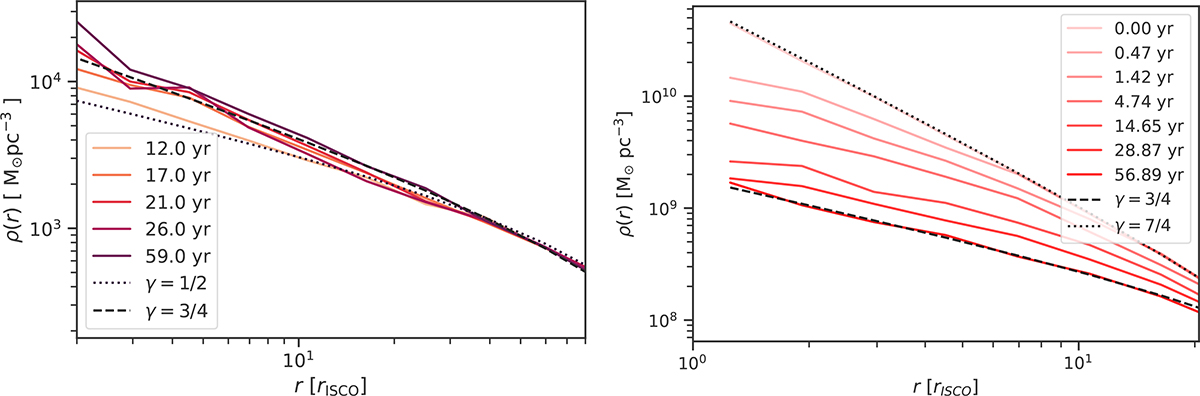
Spike density profile in the inner regions at various times for a DM spike set-up initially with two different spike indices. The left and right panels correspond to {γ, σ/mχ} of {1/2, 1.0 cm2g−1} and {7/4, 2 ⋅ 10−5 cm2g−1}, respectively. In both panels, the dotted lines are the initial density profile that is sampled and the dashed lines correspond to a spike profile with an index of 3/4. For both steeper and shallower starting profiles, we see that the spike index evolves towards γ = 3/4.
Current usage metrics show cumulative count of Article Views (full-text article views including HTML views, PDF and ePub downloads, according to the available data) and Abstracts Views on Vision4Press platform.
Data correspond to usage on the plateform after 2015. The current usage metrics is available 48-96 hours after online publication and is updated daily on week days.
Initial download of the metrics may take a while.