Fig. 4
Download original image
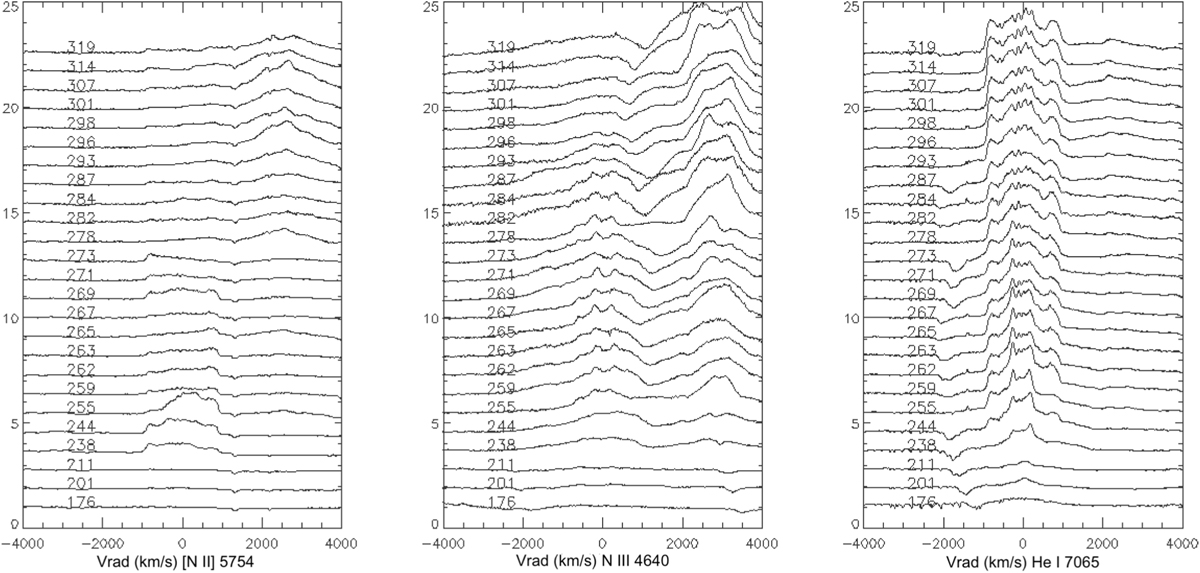
Line profile variations of, from left to right, [N II] 5754 Å, N III 4640 Å, and He I 7065 Å in the days after the outburst. The He I line shows the response of permitted lines formed by recombination. The profiles were normalized to the flux at −3800 km s−1, displaced by a constant increment, and the spectra are labeled with the day since discovery.
Current usage metrics show cumulative count of Article Views (full-text article views including HTML views, PDF and ePub downloads, according to the available data) and Abstracts Views on Vision4Press platform.
Data correspond to usage on the plateform after 2015. The current usage metrics is available 48-96 hours after online publication and is updated daily on week days.
Initial download of the metrics may take a while.