| Issue |
A&A
Volume 703, November 2025
|
|
|---|---|---|
| Article Number | A238 | |
| Number of page(s) | 10 | |
| Section | Stellar atmospheres | |
| DOI | https://doi.org/10.1051/0004-6361/202555628 | |
| Published online | 21 November 2025 | |
Radiative response of nova ejecta to illumination variations in the post-outburst white dwarf: V1405 Cas 2021
1
Dipartimento di Fisica, Università di Pisa,
largo B. Pontecorvo 3,
Pisa
56127,
Italy
2
INAF-OATS,
Via G.B. Tiepolo 11,
34143
Trieste,
Italy
3
INAF Astronomical Observatory of Padova,
36012
Asiago (VI),
Italy
4
School of Physics & Astronomy, University of Leicester,
University Road,
Leicester
LE1 7RH,
UK
5
Astronomical Ring for Amateur Spectroscopy (ARAS Group),
Rouen,
France
★ Corresponding authors: This email address is being protected from spambots. You need JavaScript enabled to view it.
; This email address is being protected from spambots. You need JavaScript enabled to view it.
Received:
22
May
2025
Accepted:
24
September
2025
Abstract
Aims. The nebular stage is that interval in the expansion of classical nova ejecta when the transparency of the matter permits a comprehensive view of the structure of the ejecta. We aim to study the radiative response of nova ejecta to illumination variations in the post-outburst white dwarf (WD).
Methods. We used medium-resolution (R ≈ 104) optical spectra, a substantial fraction of which were flux-calibrated. Time series were obtained for profile and flux variations supplemented by Swift X-ray Telescope (XRT) spectrophotometry. The ejecta structure and density stratification were modeled assuming nebular conditions with biconical geometries, and densities were derived using the [O III] lines and scaled for ejecta expansion.
Results. Antiphase variations were observed for the C IV 5808 Å recombination line and coronal transitions of [Fe VII] and [Ca V] coincident with X-ray flaring activity of the central WD. In the earlier transition stage to nebular conditions, similar profile and flux variations were observed for [N II] 5755 Å, although no X-rays were detected during that time. We show that the profile variations map the density structure of the ejecta and are entirely due to changes in the hardness of the incident spectral distribution of the white dwarf. No dynamical explanation is required.
Conclusions. Nebular stage line intensity and profile variations permit a comprehensive view of the development of the central white dwarf without recourse to other wavelength intervals, such as X-rays or the far-UV.
Key words: atomic processes / hydrodynamics / radiative transfer / circumstellar matter
© The Authors 2025
 Open Access article, published by EDP Sciences, under the terms of the Creative Commons Attribution License (https://creativecommons.org/licenses/by/4.0), which permits unrestricted use, distribution, and reproduction in any medium, provided the original work is properly cited.
This article is published in open access under the Subscribe to Open model. This email address is being protected from spambots. You need JavaScript enabled to view it. to support open access publication.
1 Introduction
The slow classical nova V1405 Cas (Nova Cas 2021, PNV J23244760+6111140) was detected in outburst by Nakamura on 2021 March 18.424 UT (MJD 59291) and reported as a classical nova in ATel 14472. The AAVSO V photometric light curve is shown in Fig. 1. Since its discovery, several studies have outlined V1405 Cas’s spectroscopic and photometric behavior. Valisa et al. (2023) present a detailed overview of the dataset which we hereafter refer to as the “Asiago sample”, and an archive of small telescope spectroscopic observations, hereafter called the “ARAS sample”. A comprehensive analysis is presented in Di Giacomo (2024), to which the reader is referred for an overview of the complete ground-based optical photometry and spectroscopy and Swift ultraviolet photometry and X-ray observations. Low-resolution spectra of the initial, optically thick stages were presented by Taguchi et al. (2023). Our first observations, from MJD 59292-59296 were contemporaneous with these. A discussion of this stage is included in Di Giacomo (2024) and will be elaborated in a separate publication.
In this paper, we concentrate on the variations observed in the emission line profiles during the optically thin phase of the ejecta expansion. We introduce a new approach to understanding the physical processes and mechanisms driving the evolution of classical novae in this crucial phase, shedding light on the interplay between the expanding ejecta and the underlying stellar system.
2 Data
The Asiago high-resolution, long-slit echelle spectra of V1405 Cas were obtained with three different telescopes. The Stroncone 0.50m and Varese 0.84m telescopes used a mk.III Multi-Mode spectrograph from Astrolight Instr., with a prism acting as cross-disperser, covering the 4250-8900 Å range in 32 orders at resolving power λ/∆λ=20000 for 1× binning and a 1-arcsecond slit width (reducing to 15 000 for a 2-arcsecond slit and 12000 if 2× binning is adopted). The Asiago 1.82m telescope was used with a REOSC echelle spectrograph, with a grating acting as cross-disperser, covering the range 35007350 Å in 32 orders at a resolving power 22 000 for a 2-arcsecond slit and 1× binning. The long-slit (about 20-arcsecond height) mode of operation of these spectrographs provides simultaneous recording of the sky background. The slit was always aligned along the parallactic angle for optimal flux calibration against the spectrophotometric standard stars observed on each night. The data reduction, performed using IRAF, involved all the usual steps of bias and dark subtraction, flat-fielding with quartz lamps, sky-background subtraction, wavelength calibration against thorium lamps, heliocentric correction, and final flux-calibration against the spectrophotometric standard stars of the night. The ARAS sample consists of flux-calibrated echelle spectra spanning approximately 3900-8000 Å with a resolution of ≈ 10 000 reduced using IRIS1. Fluxes were obtained from AAVSO visual photometry. X-ray observations from 0.3 to 10 keV with the Swift XRT began at discovery, the details are provided in Sect. 5.
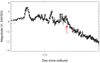 |
Fig. 1 Visual light curve of V1405 Cas during the interval covered by the spectroscopic sequences presented here (credit: AAVSO). The start of the nebular stage is after the last excursion as indicated by the arrow. |
3 Post-maximum spectroscopic development
Following a protracted period at visual maximum, V1405 Cas entered the transition stage around 200 days after discovery, based on the disappearance of P Cyg absorption on permitted lines of, for example, Fe II and Hβ. We begin the discussion here with the determination of the structural properties of the ejecta that we then use to analyze the spectral variations.
3.1 Density and structure determinations
The [O III] 4363, 4949, 5007 Å multiplet is shown in Fig. 3. We determined a volume-averaged electron density using the integrated line flux ratio2 for day 347, after the onset of the nebular lines and the last possible date for a reliable measurement of the 4363 Å line is possible. The measured, uncorrected fluxes were 1.83, 0.64, and 1.97 (in 10−12 erg s−1 cm−2 for 5007, 4959, and 4363 Å, respectively, with an uncertainty of 5%). The flux ratio R ≡ Funred(4959 + 5007)/Funred(4363) was used to obtain the electron density to temperature ratio from

where T4 is the electron temperature in units of 104K, ne is the electron number density Osterbrock & Ferland (2006). For 0.5 < E(B - V) < 0.9 (Valisa et al. 2023), the de-reddened ratio was 12.6 > R > 1.9, so for T4 = 1 the electron density in the lineforming region of the ejecta was ne ~ (2.3 ± 0.4) × 107 cm−3. It is not possible to give a more precise value than the volume-integrated measure because of the weakness and blending of the lines. This density is weighted toward the inner, denser parts of the ejecta but applies only where the density is lower than the critical value.
The ejecta structure was modeled using an axisymmetric (biconical) geometry as described in Mason et al. (2018, and references therein). The Monte Carlo code assumes a linear velocity law for the expansion resulting from ballistic ejection which gives a power law density distribution in radius r, ρ ~ r−n with an exponent of n = 3. The maximum (outer) radius at time t after outburst is R(t) = vmax t, vmax is the maximum outward velocity (radial relative to the central star). The emissivity is scaled as ρm where here m = 2. The bounding angles for the cone are 20° (range ± 10°) and 90°(the ejecta axis is defined as 90°), the radial thickness is ∆R/R = 0.6 (range ±0.1), and the inclination is i = 50° (range ± 5°). Fig. 2 shows the comparison between the model and observed [Fe VII] 6086.86 Å and Hβ on day 589 of the Asiago sequence. The comparison is illustrative; in this paper we make no more than qualitative use to show that the profile structure is just a consequence of the geometry and stratification of the ejecta and does not require the contribution of an accretion disk (Mason et al. 2021).
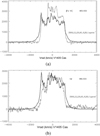 |
Fig. 2 Comparison 589 days after the outburst between the model with parameter values described in the text, shown as a thick line, and [Fe VII] 6086.86 Å (a) and Hβ (b), both thin lines. |
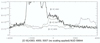 |
Fig. 3 Profiles of [O III] triplet 353 days after the outburst used to estimate the mean electron density in the ejecta. |
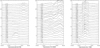 |
Fig. 4 Line profile variations of, from left to right, [N II] 5754 Å, N III 4640 Å, and He I 7065 Å in the days after the outburst. The He I line shows the response of permitted lines formed by recombination. The profiles were normalized to the flux at −3800 km s−1, displaced by a constant increment, and the spectra are labeled with the day since discovery. |
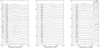 |
Fig. 5 Variations in the recombination line profiles of, from left to right, He I 6678 Å, He II 5411 Å, and C IV 5808 Å during the coronal line stage. The spectra were normalized to the flux at −3800 km s−1 for display purposes, and the numbers indicate days since the outburst. The helium lines are included to highlight the ionization state of the ejecta (see text for further discussion). |
4 Line profile variations
4.1 [N II] profile variations
The [N II] 5754 Å and N III 4640 Å comparative time series is shown in Fig. 4. The He I 7065 Å line is shown for comparison, especially with N III, as a recombination tracer. Such profile variations do not seem to have been reported in other classical novae. During the interval from day 255 to 273, the profile underwent two shifts in symmetry centered on day 244, as seen in Fig. 4. The profile on that day was the same as that eventually displayed on all of the ejecta lines, for example after day 280. The core of the profile is weighted toward the inner ejecta in velocity and density, and thus the dominance of, first, the blueshifted and then red-shifted portion above |vrad| ≈ 1000 km s−1 of the extreme velocity indicates that the outer ejecta responded on a different timescale to the illuminating source.
As determined from the model parameters, scaling the mean density obtained from [O III], the recombination time for the wing-forming parts of the ejecta is about a factor of 10 longer than for the innermost portion. Using the Bryans et al. (2006) method, the recombination time for ne ≈ 106 cm−3 and an electron temperature of 104 K to be about one day while the light travel time is about 4 days. It is perhaps not coincidental that this is about the duration of the episode.
The He II 4686, 5411 Å lines are proxies for the recombination-dominated transitions. Their profiles are the same of those of C IV 5308 Å and, before the final coronal line stage, different from those of [Fe VII] and [Ca V]. They are consistent with the density stratification, and emission measure, for a ballistic medium with stronger cores than wings. Unlike the forbidden lines, neither He II nor the Balmer lines show strong, variable asymmetries.
4.2 Coronal line profiles
The coronal transitions [Fe VII] 5721.15 and 6086.92 Å were first detected around day 460. At the final epoch of our temporal sequence (day 686) provide by the Asiago data, the coronal line profiles exhibit a structure similar to that of He II 4686 Å; a flux-scaled comparison of [Ar V] 7005 Å, [Fe VII] 6086 Å and He II 4686 Å, reveals that the coronal line ions and He+ have a common structure (Fig. 5). There is a considerable difference in how the lines are formed, by recombination for He II 4686 Å and by collisional excitation for [Fe VII] (see Fig. B.1). The density sensitivity of these two transitions is complementary: the density should be as high as possible for He II and as low as possible for [Fe VII] under optically thin conditions. The critical electron density for [Fe VII] is ne,crit ~ 3 × 107 cm−3 (Mason et al. 2018); for other coronal lines ne,crit is in the range 106 to 108 cm−3 3.
The blend between [Fe VII] and [Ca V] 6086.37 Å can be disentangled using [Ca V] 5309.11 Å. The [Ca V] lines were present from day 309 to 465 (see Fig. B.2). Since the ionization potential for Ca+3 is near that for He+ but much lower than that for Fe+5, its earlier appearance shows that the ionization of the ejecta continued to increase through the nebular stage until freeze-out. There was no sign of [Fe X] and Fe+6 was the highest ionization present.
The individual emission peaks were particularly distinct for [Fe VII], the most highly ionized species detected in the nebular stage. This shows that the density contrasts, knots or filaments, persist overall but change in relative intensity driven by variations in the ionizing source. The strength of an individual peak depends on the density so the line profiles change as different regions fall below the threshold for phenomena such as the collisional damping of the forbidden line or fail to exhibit sufficient contrast from recombination (Mason et al. 2018).
4.3 CIV versus [Fe VII]profile variations
An unexpected result is the antiphased variations of CIV 5808 Å line and the [Fe VII] and [Ca V] lines during the interval between day 300 and day 450. The ionization potential for C+2 (48 eV) is below that of He+ (54 eV) which is lower than the value for C+3 (64 eV) and considerably lower than Fe+6 (129 eV). The C IV line, which like He II is due to recombination, displayed a fluctuating emissivity during the interval following the Swift X-ray brightening and in precise antiphase with the [Fe VII] variations, see Figs. 6 and 7. In light of the difference between the ionization potentials, this appears to be purely radiative in origin, an effect of the variations in the incident radiation. When the incident spectral energy distribution (SED) turns hard, C IV disappears and [Fe VII] appears; when the source turns softer, the opposite happens.
5 X-ray emission
The Neil Gehrels Swift Observatory (Swift hereafter) Gehrels et al. (2004), began observations of V1405 Cas on 2021 March 24. Given the optical and UV brightness of the nova, only grade 0 (single pixel) XRT (Burrows et al. 2005) events were considered in order to mitigate complications from optical loading4. No X-ray source was found at this time, with the first believable detections occurring on days 73 and 89. From day 270, until day 862, X-rays were consistently detected with an integrated X-ray count rate of between ~0.01 and 0.05 count s−1.
After a gap in observations, data obtained on 2024 October 24 (day 1315) not only that the nova was still detected in the soft X-ray band, but that it was a factor of 3 brighter than the previous observation on 2023 July 23, with a conspicuous supersoft source (SSS) component not seen in any earlier observations (Page & Shore 2024). This soft component remained detectable until the most recent observations (day 1555). Fig. 8 shows the X-ray flux and recovered spectral properties based on Swift XRT observations.
Spectra were extracted and fitted for all XRT observations from day 270 onward. A preliminary investigation showed no strong evidence of variable absorption, with a mean value of 4.2 × 1021 cm−2 during the SSS phase. The spectra were therefore refitted with NH fixed at this value to better constrain the other parameters. Before day 600, the spectra could be fitted with a single optically thin plasma component using (APEC in XSPEC). Fits to the later spectra, however, were improved by a second, cooler component, which we parameterized as a blackbody (BB). This component initially had a temperature of ~90-140 eV, but after day 1315 the BB was noticeably cooler and softer, with kinetic temperature of typically ~20-30 eV. The temperature of the optically thin APEC model increased when the second BB component was also required to fit the spectra, from <0.7 keV to a few keV. The parameters from the spectral fitting are shown in Fig. 8, together with the observed flux over 1-10 keV.
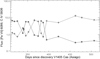 |
Fig. 7 Integrated line flux variations for C IV 5808 Å (squares) vs. [Fe VII] 6086 Å (plus) in days after the outburst (units: 10−12 erg s−1 cm−2). The points are connected to render the antiphase variability more visible; typical uncertainties are 10%. |
6 Physical interpretation of line profile variations
We propose that the phenomena we report here are the strongest indication yet available in a late nova outburst that the spectral changes reflect only radiative and not hydrodynamic processes and that even lacking X-ray observations the behavior of the central source can be inferred to have been fluctuating in the same manner that has been observed in other classical novae (e.g., V339 Del) seen in the SSS stage earlier in an outburst.
The radiative recombination rate αrad, for C+3, for an electron temperature Te = 104K from the Cloudy atomic database5, is αrad ≈ 9.2 × 10⁻¹² cm3 s−1. For ne ≈ 2 × 107 cm−3 from the [O III] analysis, the recombination timescale is less than one day. However, about 350 days after discovery, light travel time of the inner parts of ejecta (which have a νrad ≈ 103 km s−1) increased to about one day, and the outermost radius about twice that. As a result, although the recombination is almost instantaneous, smearing from the size of the ejecta produces a response time of a few days. The same roughly applies to Fe+6 for which αrad ≈ 4 × 10⁻¹¹ cm3 s−1; for this ion, the density was lower and the light travel time longer but still around the same order of magnitude as for C+3.
The appearance of broad wings during the strong line phase was attributed to mass ejection episodes for V659 Sct (N Sct 2019) by Munari et al. (2022). They concentrated on the [Fe VII] and [Fe X] lines (the latter was not detected in V1405 Cas), finding that the flare episodes produced recombination events that quenched the ionization state through recombination of an optically thick covering of the central white dwarf. Once the newly ejected gas turned transparent, the high ionization lines reappeared. In our picture, the wings are another result of fluctuations in the incident spectral distribution from the photosphere of the WD. It is the effect of the ionization (or recombination) wave producing emission at the same maximum radial velocity determined from the absorption trough and red emission wing during the earlier plateau phase. A power law density profile was imposed on the ejecta at the time of the explosion, which typically only affected the calculation of the emission measure. For a stationary, centrally located, and optically thin environment, the emission from the ejecta will mainly decrease in intensity over time without altering its structure. However, due to the density stratification, the contribution from different parts of the ejecta will vary as they transition to the nebular stage.
It is useful to consider a finite-duration ionizing pulse. Initially, the inner, low-velocity ejecta will respond more rapidly, increasing in emissivity due to a higher density and a faster recombination. Since emissivity scales with  , the inner regions recombine first, while the outer, higher-velocity regions remain ionized longer. Consequently, the line profile will become broader and weaker at higher velocities, with a double-peaked shape and extended wings rather than a sharp peak. This shape is often misinterpreted in the literature as indicative of an accretion disk; however, it actually results from the weakness of the inner portion of the profile. In the nebular stage, regions of the ejecta that fall below a critical density threshold contribute differently to the emission lines. The peripheral region reaches this threshold first. Consequently, the lower-ionization emission lines, such as [O III] and [O II], will first appear as broad features due to the lower density and higher expansion velocity in the outer regions where forbidden lines dominate. In contrast, permitted lines, which are more sensitive to the higher-density inner regions, will have wings with similar velocities but with stronger line cores.
Interpreting emission profiles from dynamic, extended structures like this nova, especially using time-series data, requires high-resolution observations to properly account for these time delays (Fig. 9). If the central source in an H II region turns off, recombination will occur spherically around the central object. The lines either weaken or strengthen monotonically, depending on the ionization stage, because the environment is uniform. This is very different for the expanding ejecta and has consequences for interpretations of the dynamics, densities, abundances, and structure of the ejecta inferred from line profiles. The [N II] variations provide a case in point. For ionization, N+ → N+2, the blue side of the profile should decrease first leading to a redshift of the mean radial velocity. For recombination, in contrast, the situation is more complicated for forbidden transitions since their line strength depends on the critical electron density. The recombination time is  for ballistic expansion but ne,crit also varies as
  so there is a specific radial velocity above which the transition is not collisionally damped. This depends on the specific transition. If the ejecta are sufficiently tenuous everywhere, then for N+2 → N+, the blue side of the profile increases first. If, however, only the higher expansion velocity gas is below ne,crit, the blue side of the line will still appear first but the profile will be more asymmetric and weighted toward a higher radial velocity beginning at the recombination time. This variability competes with the timescale for any radiative forcing by the WD; therefore, if the central source fluctuates with a similar cadence as the light travel time, transitions can be affected differently depending on whether they are permitted for forbidden transitions.
The simultaneous presence of [Ar V] and [Fe VII] lines indicates that the WD was sufficiently hot to sustain high ionization levels for the whole Asiago sequence (Fig. B.1). Ionization freeze-out occurred before our last spectrum, so the [Fe VII] and [Ca V] lines in the last spectrum of the Asiago sequence show that the spectral hardness was substantially greater then and, as in the current observations, later reduced to a value below the ionization of He+. A low-resolution spectrum (R of −800) in the range 3800-7200 Å, contemporaneous with the 2024 October XRT observation showed emission dominated by [Fe VII] and He II, with the appearance of a weak [Ca VII] doublet. The spectrum is shown in Fig. B.3. There was no trace of the [Ca V] coronal line that had been an important feature in the spectra before day 700 (Page & Shore 2024).
An important result made possible by this last spectrum, 1315 days after discovery, is that the [Fe VII] emission was declining precisely as predicted for ballistic ejecta whose line intensities vary with the emission measure,  , in the time since discovery (t - t0). The measured line flux ratio for day 1315 to day 464 is 0.04 ± 0.01 (3σ), while the predicted ratio is 0.043, evidence that the ejecta are in a frozen state. The predictions accord with the observed line fluxes based on Fig. 8, which shows the last spectrum roughly coincident with the last Swift XRT pointing.
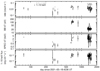 |
Fig. 8 Swift XRT observations through approximately day 1555. From top to bottom: Integrated X-ray count rate in the two bands 0.3-1 keV and 1-10 keV; derived BB temperature of the soft component; temperature derived from APEC modeling (assuming an optically thin plasma); and integrated 1-10 keV X-ray flux. |
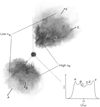 |
Fig. 9 Schematic of the ejecta indicating the density stratification responsible for the line profile variations described in Sect. 5. The insert shows how the different projected lines of sight correspond to an observed profile for the optically thin case. The observer is faced in the direction of the insert. The arrows indicate motion of individual parts of the ejecta with the length indicating the outward velocity. |
7 Conclusions
We present these observations as a cautionary tale. There is nothing special about V1405 Cas other than its membership in the subgroup of slow novae. In a more rapidly developing event, such details might be missed because of the sampling in time. It is important that the behavior we report here does not require any finely tuned physical mechanism such as shock launching or coordinated dynamics and photometric changes. If it is radiative in origin, and connected with the photometric and spectroscopic excursions of the central WD during the optically thick stage, then detecting the profile variations we describe is a matter of luck and the cadence of observations, which must be considered when interpreting emission profiles and time-series data.
The snapshot provided by each individual spectrum will incorporate all of the time delays we have described; the line profile of a single moment is, in fact, a convolution in time where the density-dependent emissivity maps onto a time sequence in the ejecta.
Acknowledgements
We acknowledge with thanks the variable star observations from the AAVSO International Database contributed by observers worldwide and used in this research. This research has made use of the Astrophysics Data System, funded by NASA under Cooperative Agreement 80NSSC21M00561. We acknowledge the use of public data from the Swift data archive. We thank Nunzia Di Giacomo for her expert rendering of the ejecta schematic in Fig. 9, and Joan Guarro Flo and Forrest Sims, of the ARAS group, for obtaining some of the spectraused in this study. SNS thanks Elena Mason, Jordi José, and Peter Höflich for extensive discussion.
References
- Bryans, P., Badnell, N., Gorczyca, T., et al. 2006, ApJS, 167, 343 [NASA ADS] [CrossRef] [Google Scholar]
- Burrows, D. N., Hill, J., Nousek, J., et al. 2005, SSRv, 120, 165 [Google Scholar]
- Di Giacomo, R. 2024, https://etd.adm.unipi.it/theses/available/etd-11052024-175238/ [Google Scholar]
- Gehrels, N., Chincarini, G., Giommi, P., et al. 2004, ApJ, 611, 1005 [Google Scholar]
- Mason, E., Shore, S. N., Aquino, I. D. G., et al. 2018, ApJ, 853, 27 [Google Scholar]
- Mason, E., Shore, S. N., Drake, J., et al. 2021, A&A, 649, A28 [NASA ADS] [CrossRef] [EDP Sciences] [Google Scholar]
- Munari, U., Righetti, G., & Dallaporta, S. 2022, MNRAS, 516, 4805 [Google Scholar]
- Osterbrock, D., & Ferland, G. 2006, Astrophysics of Gaseous Nebulae and Active Galactic Nuclei, 2nd edn. (University Science Books) [Google Scholar]
- Page, K., & Shore, S. 2024, ATel, 16876, 1 [Google Scholar]
- Taguchi, K., Maeda, K., Maehara, H., et al. 2023, ApJ, 958, 156 [Google Scholar]
- Teyssier, F. 2019, CoSka, 49, 217 [NASA ADS] [Google Scholar]
- Valisa, P., Munari, U., Dallaporta, S., Maitan, A., & Vagnozzi, A. 2023, arXiv e-prints [arXiv:2302.04656] [Google Scholar]
The reduced merged spectra are available at https://aras-database.github.io/database/novacas2021.html
We could not compare this with a similar analysis for N+ since although the excited state transition [N II] 5754 Å line was detected, the associated resonance lines were too strongly blended with Hα to be discernible.
For reference, the ionization potentials are (in eV): N+ (29.6), N+2 (47.4), and N+3 (77.5); O+ (54.9) and O+2 (77.4); Ar+2 (40.7) and Ar+3 (59.6); Ca+3 (50.9) and Ca+4 (84.3) and Fe+5 (99) and Fe+6 (125).
Appendix A Complementary observations of the [N II] profile variations from ARAS
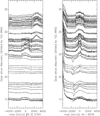 |
Fig. A.1 [N II] 5754 Å variations corroborated by the ARAS data. The ordinate is the day since outburst divided by 10 (for display), with the spectra displaced by time interval to highlight the sampling cadence. The spectra were individually normalized to the flux at +2500 km^−1. The variations of the He 16678 Å singlet are shown for comparison (right). The nebular stage began at around day 230 (see Sect. 4.1). |
Fig. A.1 shows the sequence of the [N II] 5754 Å profile variations from the ARAS database6. obtained with echelle spectrographs on small telescopes with resolutions of R≈9000 in the spectral interval 3800-9000 Å. The anomalous behavior observed in the Asiago spectra in the temporal interval from about 240 to 350 days after discovery are confirmed by these independent spectra. The He I 6678 Å profile is shown for comparison.
Appendix B Supplementary Figures
Fig. B.1 shows the comparative profiles of the [Ar V] doublet and [Fe VII] coronal lines compared to a permitted recombination line, He II, from the last day (day 684) of the Asiago sequence. Further late epoch Asiago sequence galleries are shown in Fig. B.2 for [Ca V] and [Fe VII]. Fig. B.3 is the low-resolution spectrum obtained on day 1315 at the same time as the Swift XRT observation described in the text.
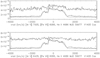 |
Fig. B.1 [Ar V] profiles from the Asiago sequence on day 685 after discovery (the last spectrum of the sequence), compared to [Fe VII] 6086 Å (thick line) and He II4686 Å (thin line); top: [Ar V] 7005 Å, bottom: [Ar V] 6435 Å. |
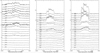 |
Fig. B.2 Comparative variations of [Ca V] 5308 Å (left) with [Fe VII] 5721 Å (center) and [Fe VII] 6086 Å (right) from the Asiago sequence. |
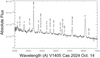 |
Fig. B.3 Final low-resolution optical spectrum from MJD 60608 (day 1315) with line identifications, see Sect. 5 for discussion. |
All Figures
|
Fig. 1 Visual light curve of V1405 Cas during the interval covered by the spectroscopic sequences presented here (credit: AAVSO). The start of the nebular stage is after the last excursion as indicated by the arrow. |
| In the text | |
|
Fig. 2 Comparison 589 days after the outburst between the model with parameter values described in the text, shown as a thick line, and [Fe VII] 6086.86 Å (a) and Hβ (b), both thin lines. |
| In the text | |
|
Fig. 3 Profiles of [O III] triplet 353 days after the outburst used to estimate the mean electron density in the ejecta. |
| In the text | |
|
Fig. 4 Line profile variations of, from left to right, [N II] 5754 Å, N III 4640 Å, and He I 7065 Å in the days after the outburst. The He I line shows the response of permitted lines formed by recombination. The profiles were normalized to the flux at −3800 km s−1, displaced by a constant increment, and the spectra are labeled with the day since discovery. |
| In the text | |
|
Fig. 5 Variations in the recombination line profiles of, from left to right, He I 6678 Å, He II 5411 Å, and C IV 5808 Å during the coronal line stage. The spectra were normalized to the flux at −3800 km s−1 for display purposes, and the numbers indicate days since the outburst. The helium lines are included to highlight the ionization state of the ejecta (see text for further discussion). |
| In the text | |
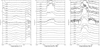 |
Fig. 6 Same as Fig. 4 but for C IV 5808 Å, [Fe VII] 6086 Å, and He II 4686 Å. |
| In the text | |
|
Fig. 7 Integrated line flux variations for C IV 5808 Å (squares) vs. [Fe VII] 6086 Å (plus) in days after the outburst (units: 10−12 erg s−1 cm−2). The points are connected to render the antiphase variability more visible; typical uncertainties are 10%. |
| In the text | |
|
Fig. 8 Swift XRT observations through approximately day 1555. From top to bottom: Integrated X-ray count rate in the two bands 0.3-1 keV and 1-10 keV; derived BB temperature of the soft component; temperature derived from APEC modeling (assuming an optically thin plasma); and integrated 1-10 keV X-ray flux. |
| In the text | |
|
Fig. 9 Schematic of the ejecta indicating the density stratification responsible for the line profile variations described in Sect. 5. The insert shows how the different projected lines of sight correspond to an observed profile for the optically thin case. The observer is faced in the direction of the insert. The arrows indicate motion of individual parts of the ejecta with the length indicating the outward velocity. |
| In the text | |
|
Fig. A.1 [N II] 5754 Å variations corroborated by the ARAS data. The ordinate is the day since outburst divided by 10 (for display), with the spectra displaced by time interval to highlight the sampling cadence. The spectra were individually normalized to the flux at +2500 km^−1. The variations of the He 16678 Å singlet are shown for comparison (right). The nebular stage began at around day 230 (see Sect. 4.1). |
| In the text | |
|
Fig. B.1 [Ar V] profiles from the Asiago sequence on day 685 after discovery (the last spectrum of the sequence), compared to [Fe VII] 6086 Å (thick line) and He II4686 Å (thin line); top: [Ar V] 7005 Å, bottom: [Ar V] 6435 Å. |
| In the text | |
|
Fig. B.2 Comparative variations of [Ca V] 5308 Å (left) with [Fe VII] 5721 Å (center) and [Fe VII] 6086 Å (right) from the Asiago sequence. |
| In the text | |
|
Fig. B.3 Final low-resolution optical spectrum from MJD 60608 (day 1315) with line identifications, see Sect. 5 for discussion. |
| In the text | |
Current usage metrics show cumulative count of Article Views (full-text article views including HTML views, PDF and ePub downloads, according to the available data) and Abstracts Views on Vision4Press platform.
Data correspond to usage on the plateform after 2015. The current usage metrics is available 48-96 hours after online publication and is updated daily on week days.
Initial download of the metrics may take a while.