Fig. 5
Download original image
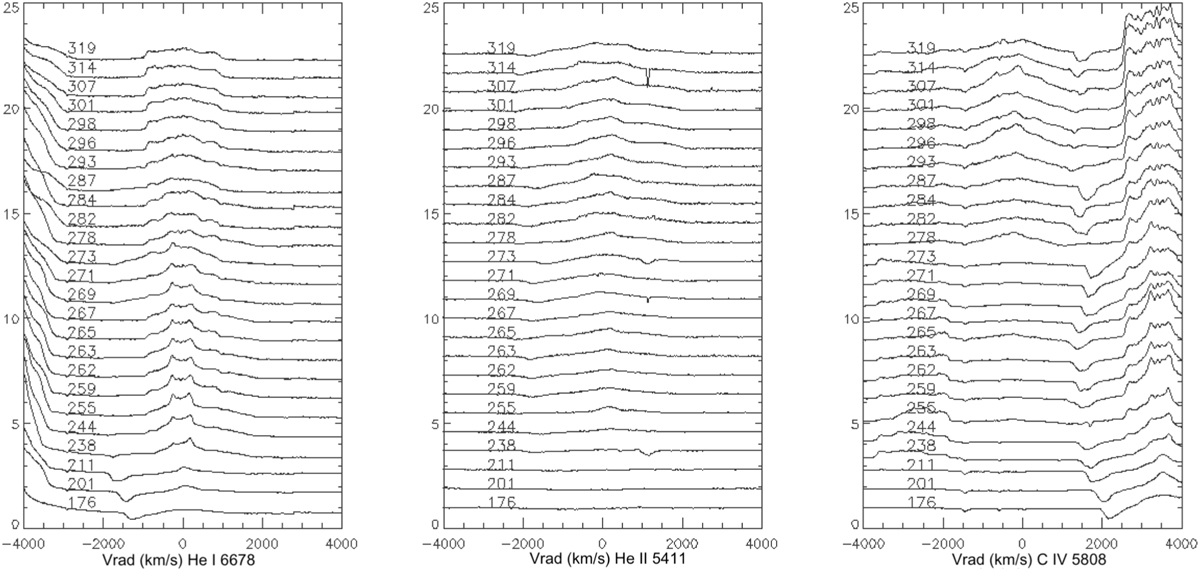
Variations in the recombination line profiles of, from left to right, He I 6678 Å, He II 5411 Å, and C IV 5808 Å during the coronal line stage. The spectra were normalized to the flux at −3800 km s−1 for display purposes, and the numbers indicate days since the outburst. The helium lines are included to highlight the ionization state of the ejecta (see text for further discussion).
Current usage metrics show cumulative count of Article Views (full-text article views including HTML views, PDF and ePub downloads, according to the available data) and Abstracts Views on Vision4Press platform.
Data correspond to usage on the plateform after 2015. The current usage metrics is available 48-96 hours after online publication and is updated daily on week days.
Initial download of the metrics may take a while.