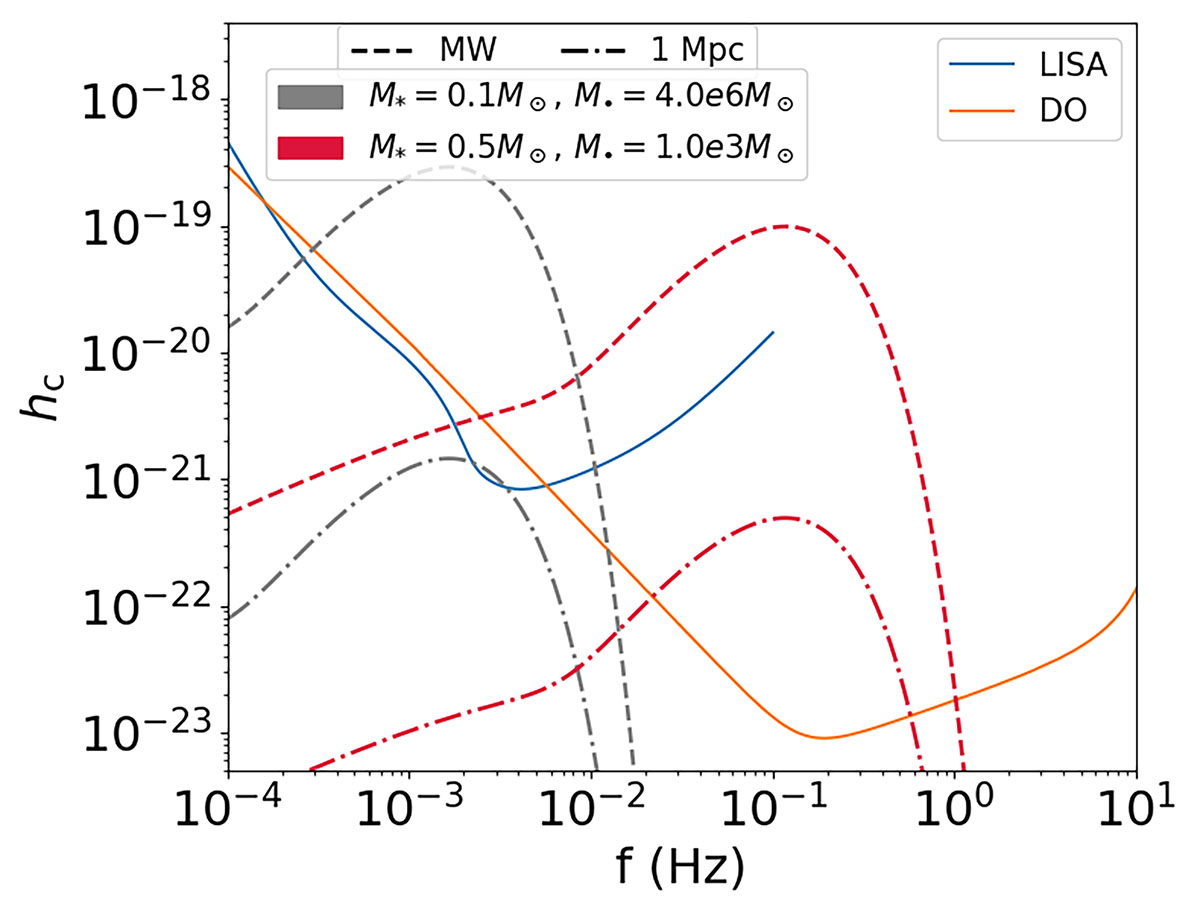
Fig. 1.
Download original image
GW signal from a fTDE of a 0.1 M⊙ MS star disrupted by a 4 × 10⁶ M⊙ BH (gray lines) and GW signal from a fTDE of a WD of 0.5 M⊙ disrupted by a 103 M⊙ BH (red lines). We consider two possible source distances: 8 kpc (dashed lines) and 1 Mpc (dash-dotted lines). In blue and orange, we plot the noise amplitudes of LISA and DO, respectively.
Current usage metrics show cumulative count of Article Views (full-text article views including HTML views, PDF and ePub downloads, according to the available data) and Abstracts Views on Vision4Press platform.
Data correspond to usage on the plateform after 2015. The current usage metrics is available 48-96 hours after online publication and is updated daily on week days.
Initial download of the metrics may take a while.