Fig. A.1.
Download original image
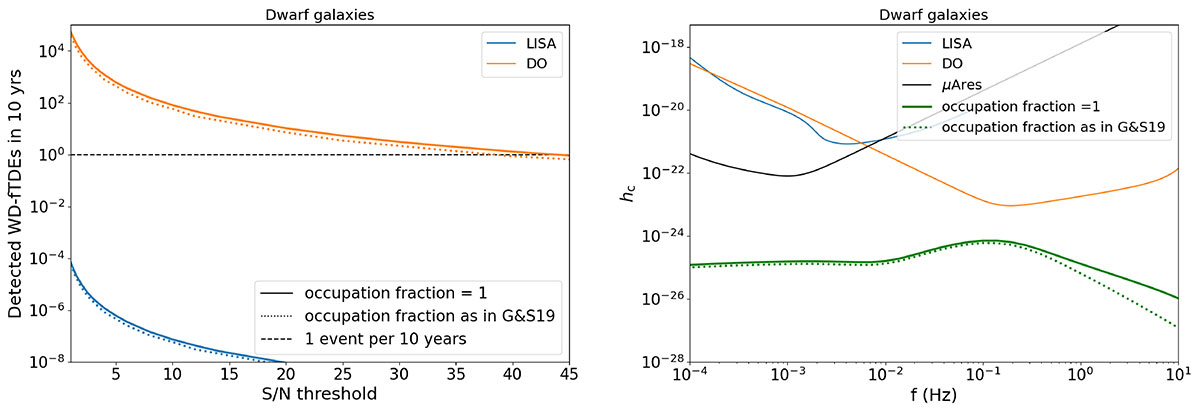
Left panel: detection rates of WD-fTDEs from dwarf galaxies plotted for different S/N thresholds. Right panel: GWB from WD-fTDEs from dwarf galaxies. The color scheme and the detectors are the same as in Fig. 4-5. The solid line represents an occupation fraction of 1, while the dotted line an occupation fraction as in Gallo & Sesana 2019.
Current usage metrics show cumulative count of Article Views (full-text article views including HTML views, PDF and ePub downloads, according to the available data) and Abstracts Views on Vision4Press platform.
Data correspond to usage on the plateform after 2015. The current usage metrics is available 48-96 hours after online publication and is updated daily on week days.
Initial download of the metrics may take a while.