Fig. 4.
Download original image
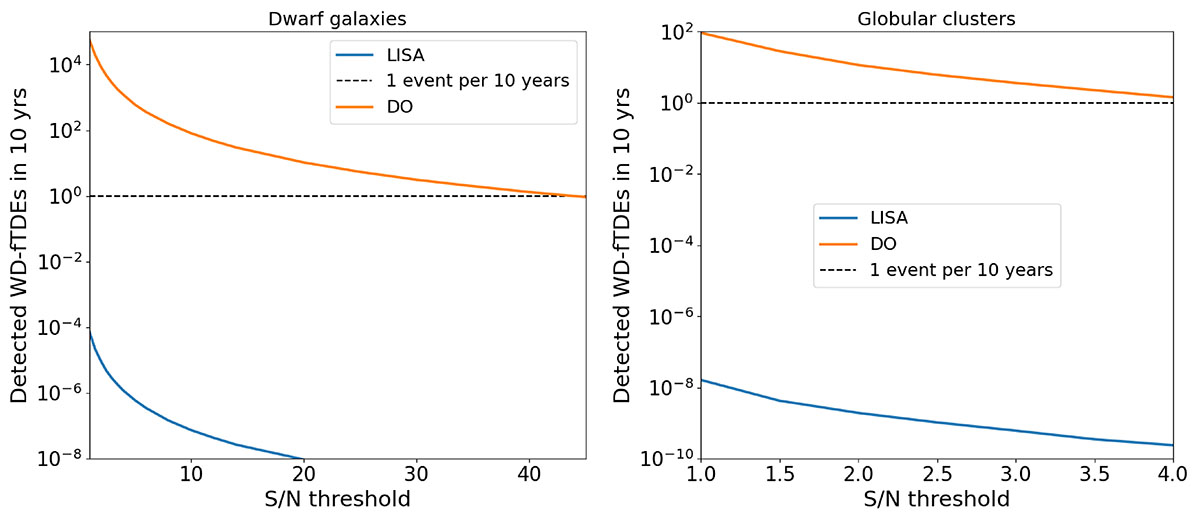
Detection rates of WD-fTDEs from dwarf galaxies (left panel) and from GCs (right panel) plotted for different S/N thresholds. The blue curve was calculated considering LISA as the detector, while the orange curve was obtained considering DO. The observation time for both instruments is assumed to be 10 years. The dashed black line is one event over 10 years. The occupation fraction is 1 for both scenarios.
Current usage metrics show cumulative count of Article Views (full-text article views including HTML views, PDF and ePub downloads, according to the available data) and Abstracts Views on Vision4Press platform.
Data correspond to usage on the plateform after 2015. The current usage metrics is available 48-96 hours after online publication and is updated daily on week days.
Initial download of the metrics may take a while.