Fig. 5.
Download original image
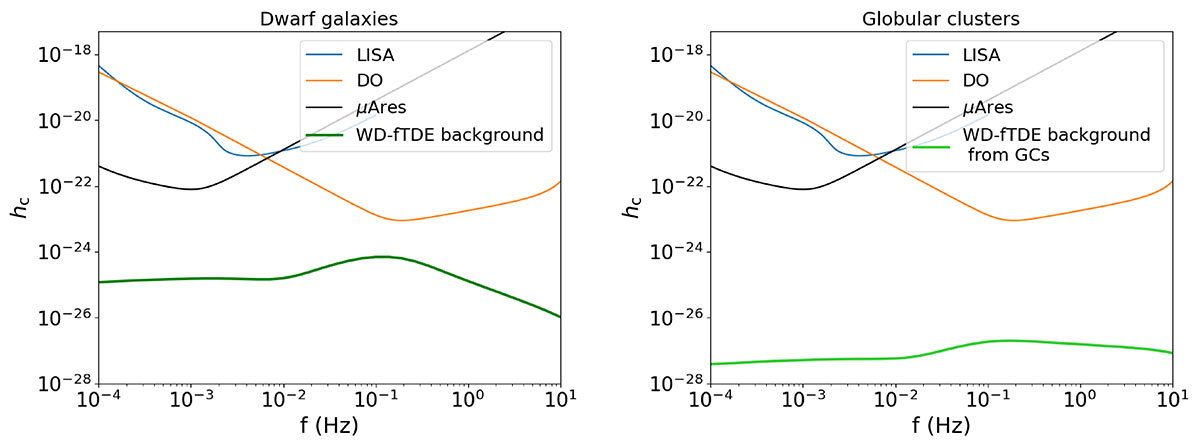
WD-fTDEs background from dwarf galaxies (dark green line, left panel) and WD-fTDEs background from GCs (light green line, right panel). We assume that the mass of the intermediate-mass BH in each GC is 103 M⊙ and that the occupation fraction is equal to 1 for both scenarios. Both signals are plotted with respect to the sensitivity curves of LISA (blue line), DO (orange line), and μAres (black line).
Current usage metrics show cumulative count of Article Views (full-text article views including HTML views, PDF and ePub downloads, according to the available data) and Abstracts Views on Vision4Press platform.
Data correspond to usage on the plateform after 2015. The current usage metrics is available 48-96 hours after online publication and is updated daily on week days.
Initial download of the metrics may take a while.