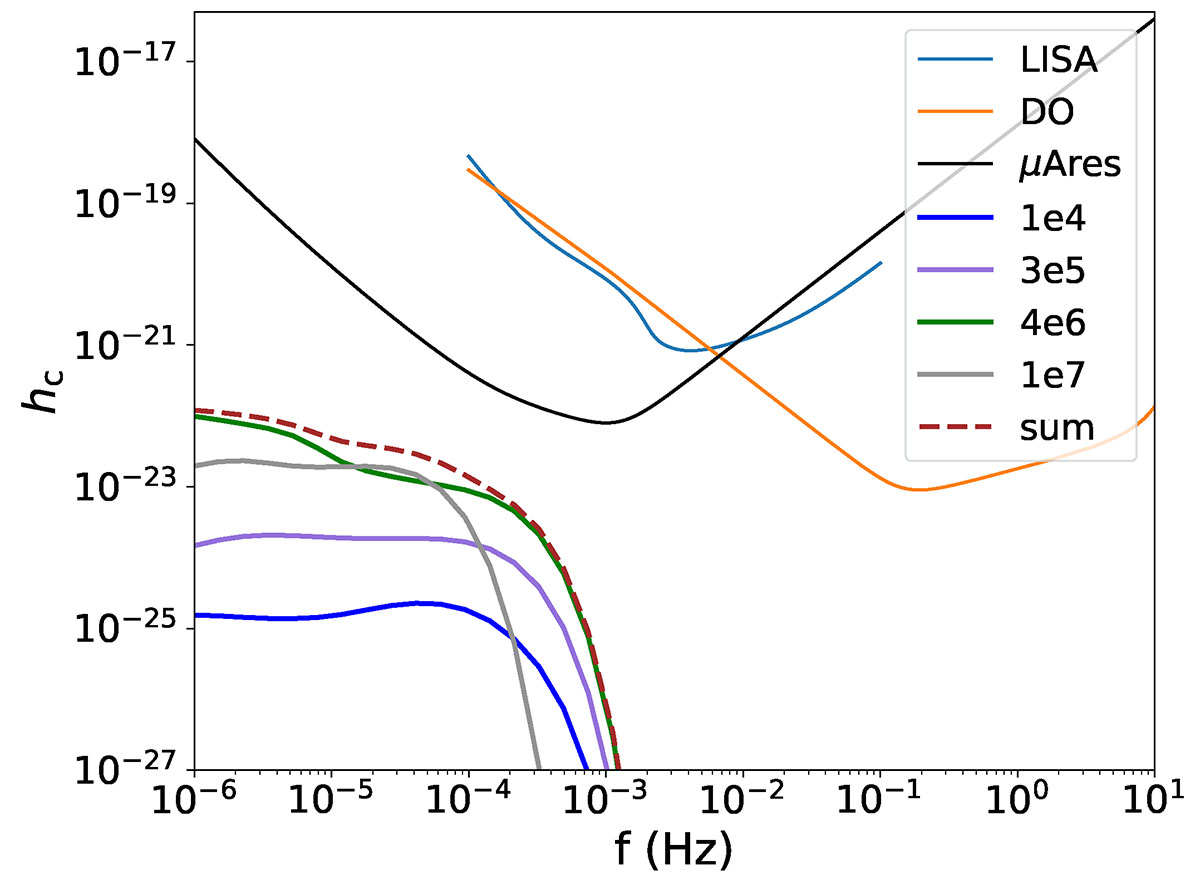
Fig. 6.
Download original image
Background signals from different populations of rpTDEs: the solid blue line is the signal from rpTDEs with a BH of mass M• = 104 M⊙, the solid purple line the one with M• = 3 × 10⁵ M⊙, the solid green line the one with M• = 4 × 10⁶ M⊙, and the solid gray line the one with M• = 107 M⊙. The dashed brown line is the sum of all the backgrounds.
Current usage metrics show cumulative count of Article Views (full-text article views including HTML views, PDF and ePub downloads, according to the available data) and Abstracts Views on Vision4Press platform.
Data correspond to usage on the plateform after 2015. The current usage metrics is available 48-96 hours after online publication and is updated daily on week days.
Initial download of the metrics may take a while.