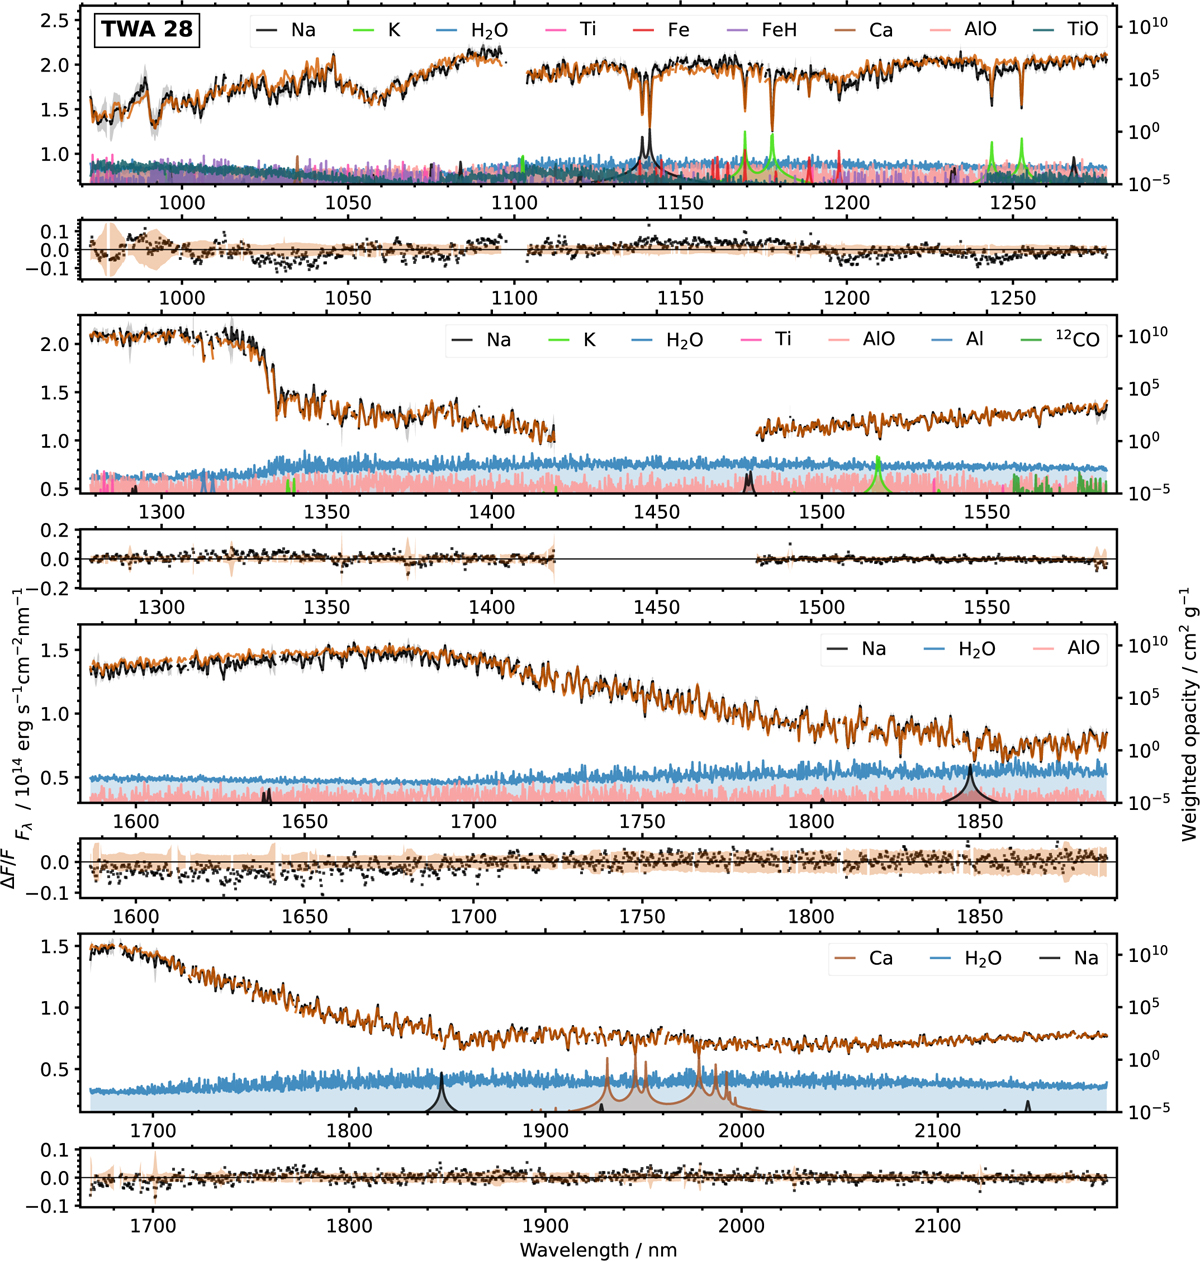
Fig. B.1
Download original image
Molecular opacity contributions to the best-fit model. The observed spectra (black) and the best-fit model spectrum of TWA 28 (orange) are shown with the opacity sources sorted by contribution in each segment of the spectrum. The smaller panels of each segment show the relative residuals as defined in Fig. 1. The opacity is weighted by the retrieved abundances of the species to scale the contribution of each species. The observed spectra and best-fit models are available at González Picos et al. 2025 (doi.org/10.5281/zenodo.15781138).
Current usage metrics show cumulative count of Article Views (full-text article views including HTML views, PDF and ePub downloads, according to the available data) and Abstracts Views on Vision4Press platform.
Data correspond to usage on the plateform after 2015. The current usage metrics is available 48-96 hours after online publication and is updated daily on week days.
Initial download of the metrics may take a while.