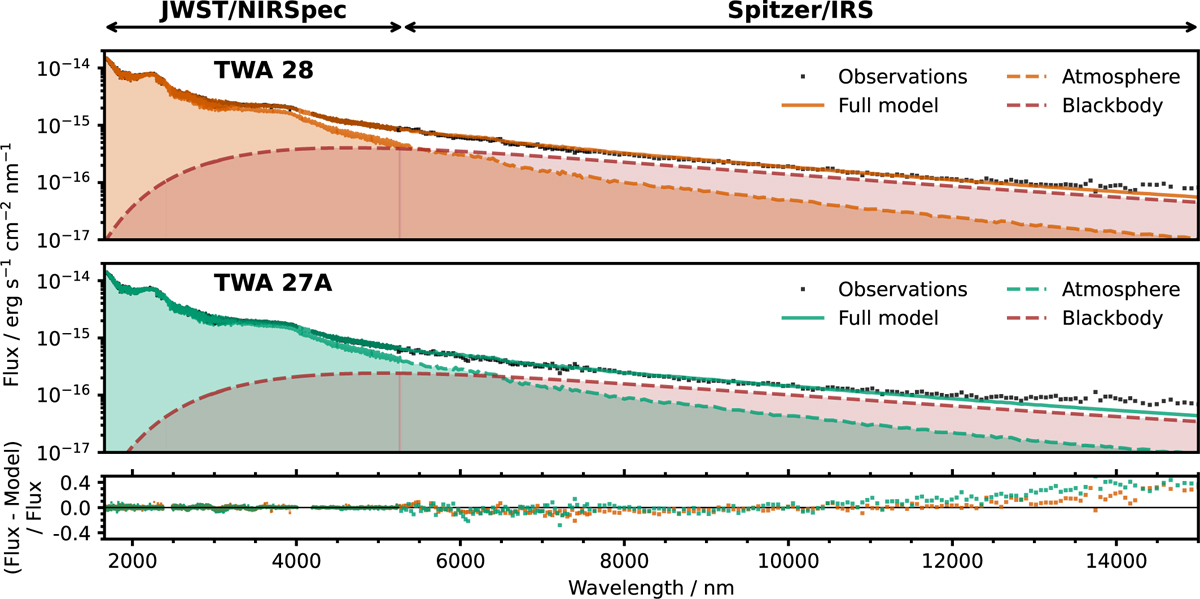
Fig. E.1
Download original image
Extended wavelength model validation with Spitzer/IRS data. The best-fit model spectra of TWA 27A and TWA 28 are extended to the Spitzer/IRS wavelength range (Riaz & Gizis 2008). Observed spectra are shown in black and the best-fit model spectra are shown as solid lines. Dashed brown lines represent blackbody emission from the disc and the dashed line with corresponding colour represents the atmospheric model. Data beyond 11 and 12 μm begin to clearly deviate from our best-fit model for TWA 27A and TWA 28, respectively.
Current usage metrics show cumulative count of Article Views (full-text article views including HTML views, PDF and ePub downloads, according to the available data) and Abstracts Views on Vision4Press platform.
Data correspond to usage on the plateform after 2015. The current usage metrics is available 48-96 hours after online publication and is updated daily on week days.
Initial download of the metrics may take a while.