Fig. 1.
Download original image
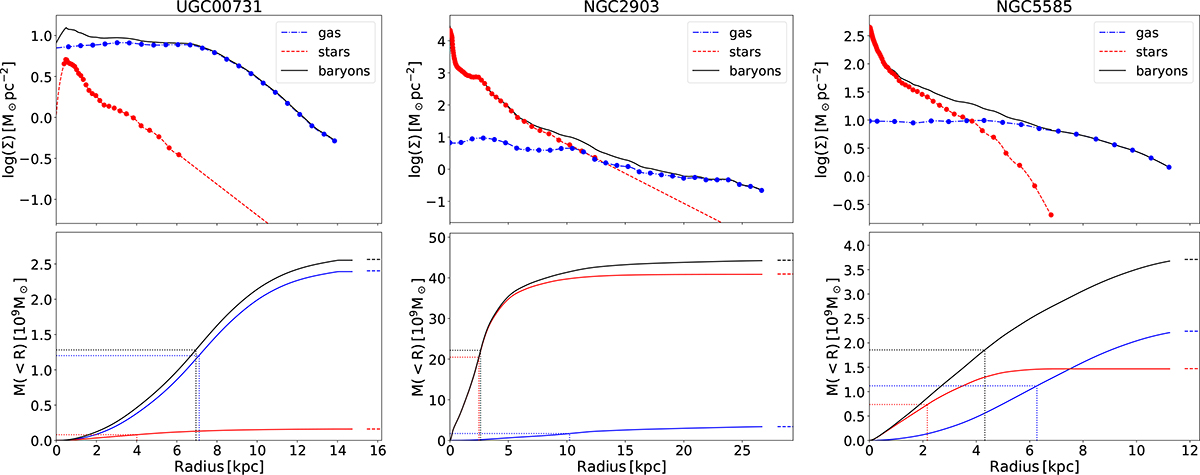
Measurements of R50, gas, R50, ⋆, and R50, bar for three example galaxies: a gas-dominated one (UGC 731), a star-dominated one (NGC 2903), and an intermediate case (NGC 5585). The upper panels show the surface density profiles for gas (blue points), stars (red points), and total baryons (black line); the stellar profile was extrapolated at large radii with an exponential function (dashed red line). The lower panel shows the curve of growth of gas (blue line), stars (red line), and total baryons (black line); the dotted lines show the location of the corresponding half-mass radii.
Current usage metrics show cumulative count of Article Views (full-text article views including HTML views, PDF and ePub downloads, according to the available data) and Abstracts Views on Vision4Press platform.
Data correspond to usage on the plateform after 2015. The current usage metrics is available 48-96 hours after online publication and is updated daily on week days.
Initial download of the metrics may take a while.