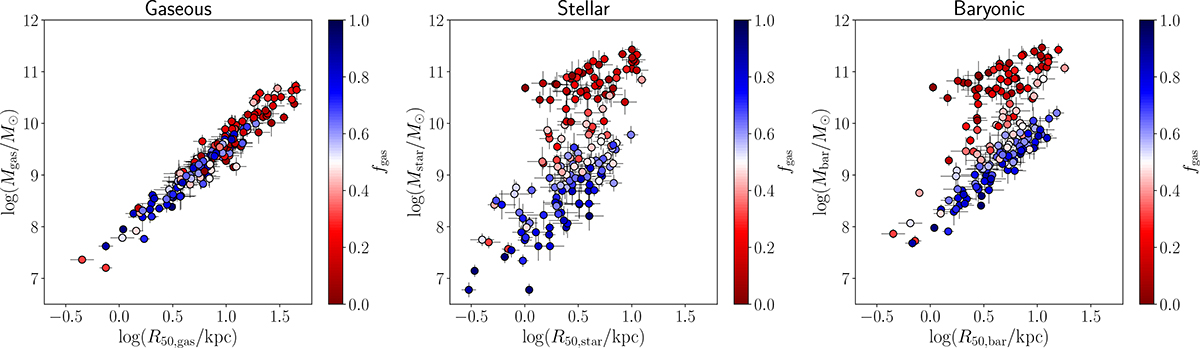
Fig. 2.
Download original image
Gaseous (left panel), stellar (middle panel), and baryonic (right panel) mass–size relations of SPARC galaxies. Data points are colour-coded by the gas fraction fgas; the error bars denote the 1σ errors. The three panels span the same dynamic range on both axes. Two sequences are evident in the stellar and baryonic mass–size relations.
Current usage metrics show cumulative count of Article Views (full-text article views including HTML views, PDF and ePub downloads, according to the available data) and Abstracts Views on Vision4Press platform.
Data correspond to usage on the plateform after 2015. The current usage metrics is available 48-96 hours after online publication and is updated daily on week days.
Initial download of the metrics may take a while.