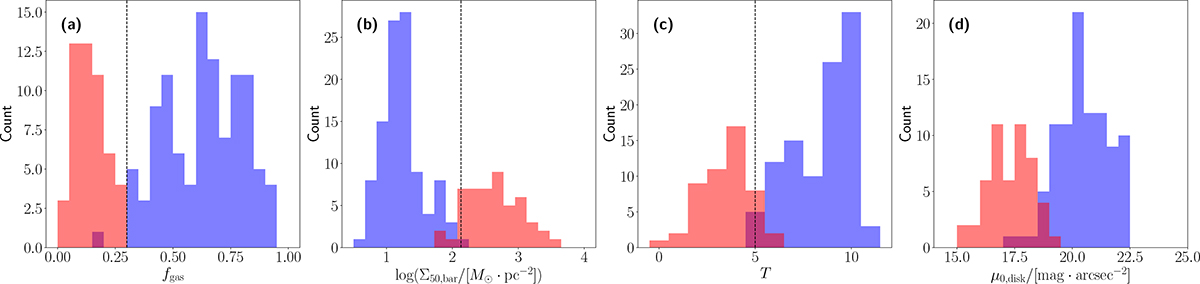
Fig. 3.
Download original image
Distributions of fgas, Σ50, bar, T, and μ0, disk for the two groups identified by DBSCAN (red and blue histograms). The dashed black lines show the separation values reported in Table A.2. Panels (a)–(c) show the distributions clustered by logΣ50, bar, while panel (d) shows the distributions clustered by μ0, disk (after correction to a face-on view).
Current usage metrics show cumulative count of Article Views (full-text article views including HTML views, PDF and ePub downloads, according to the available data) and Abstracts Views on Vision4Press platform.
Data correspond to usage on the plateform after 2015. The current usage metrics is available 48-96 hours after online publication and is updated daily on week days.
Initial download of the metrics may take a while.