Fig. 4.
Download original image
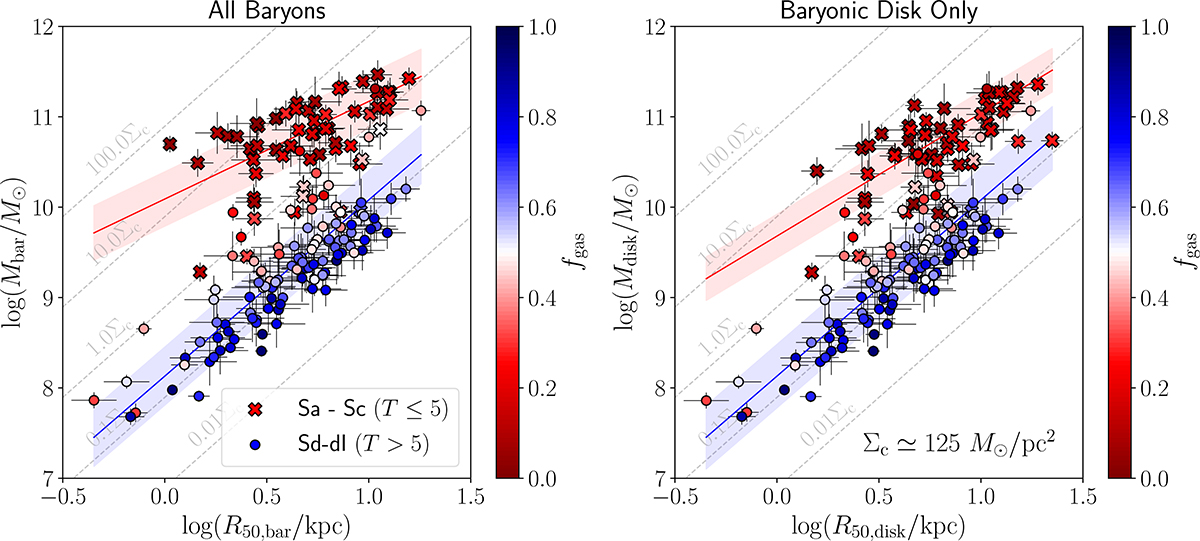
Baryonic mass–size relations considering all baryons (left panel) and the baryonic disks only (excluding stellar bulges, right panel). Galaxies are colour-coded by the gas fraction fgas. Crosses represent S0-to-Sc galaxies (Hubble type T ≤ 5), while circles represent Sd-to-dI galaxies (T > 5). The red and the blue solid lines show the best-fit relations to the HSD and LSD sequences, respectively; the red and blue shaded areas indicate the best-fit intrinsic scatters. Dashed lines correspond to constant surface densities for multiples of Σc = 125 M⊙ pc−2 (see Sect. 3 for details).
Current usage metrics show cumulative count of Article Views (full-text article views including HTML views, PDF and ePub downloads, according to the available data) and Abstracts Views on Vision4Press platform.
Data correspond to usage on the plateform after 2015. The current usage metrics is available 48-96 hours after online publication and is updated daily on week days.
Initial download of the metrics may take a while.