Fig. 5.
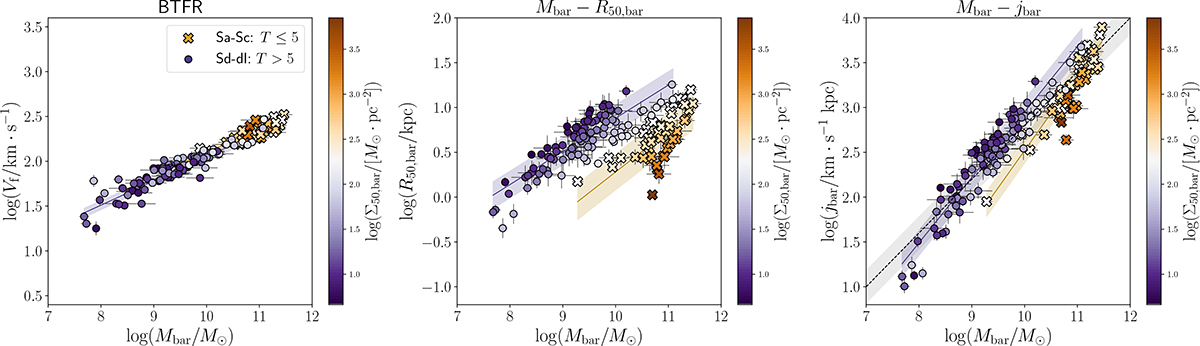
Download original image
Scaling relations of galaxies the baryonic Tully–Fisher relation (left panel), the baryonic mass–size relation (middle panel), and the baryonic angular-momentum relation (right panel). The three panels cover the same dynamic range on the y-axis. The circles and crosses are the same as those in Fig. 4, colour-coded by the effective baryonic surface density Σ50, bar. The blue and gold solid lines are the best-fit lines for LSD galaxies and HSD galaxies, respectively. The dashed black line in the right panel shows the best-fit line considering all 147 galaxies together.
Current usage metrics show cumulative count of Article Views (full-text article views including HTML views, PDF and ePub downloads, according to the available data) and Abstracts Views on Vision4Press platform.
Data correspond to usage on the plateform after 2015. The current usage metrics is available 48-96 hours after online publication and is updated daily on week days.
Initial download of the metrics may take a while.