Fig. 3
Download original image
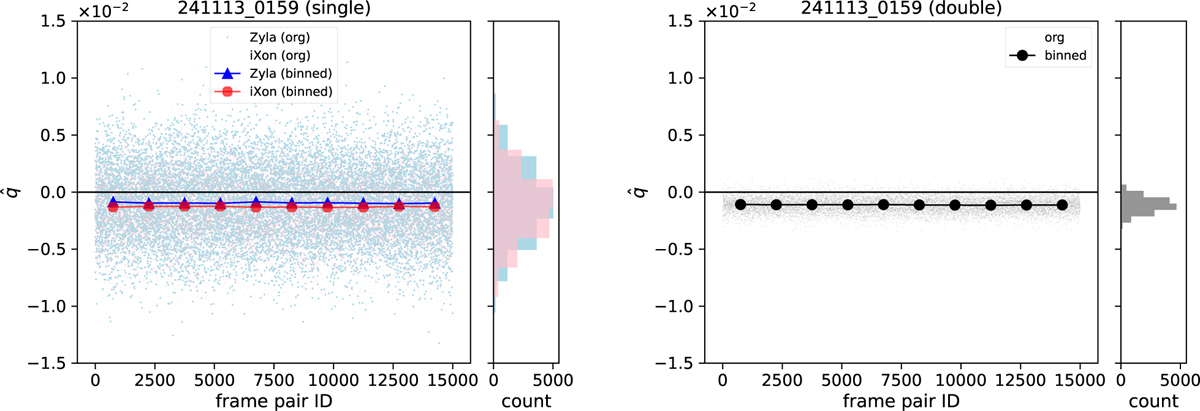
![]() values derived from one take (30 000 frames of observations) of β Cas on Nov. 13, 2024. Left: results from the single-ratio method, where blue plots are from Zyla and pink/red plots are from iXon. Right: results from the double-ratio method. The horizontal axis of each panel is equivalent to a time domain spanning 150 s. The smaller dots represent all measurements (15 000 values). The larger plots (connected by lines) are results after the original values are divided into ten bins. The histograms are displayed on the right side, with colors matching those of the scatter plots.
values derived from one take (30 000 frames of observations) of β Cas on Nov. 13, 2024. Left: results from the single-ratio method, where blue plots are from Zyla and pink/red plots are from iXon. Right: results from the double-ratio method. The horizontal axis of each panel is equivalent to a time domain spanning 150 s. The smaller dots represent all measurements (15 000 values). The larger plots (connected by lines) are results after the original values are divided into ten bins. The histograms are displayed on the right side, with colors matching those of the scatter plots.
Current usage metrics show cumulative count of Article Views (full-text article views including HTML views, PDF and ePub downloads, according to the available data) and Abstracts Views on Vision4Press platform.
Data correspond to usage on the plateform after 2015. The current usage metrics is available 48-96 hours after online publication and is updated daily on week days.
Initial download of the metrics may take a while.