Fig. 4
Download original image
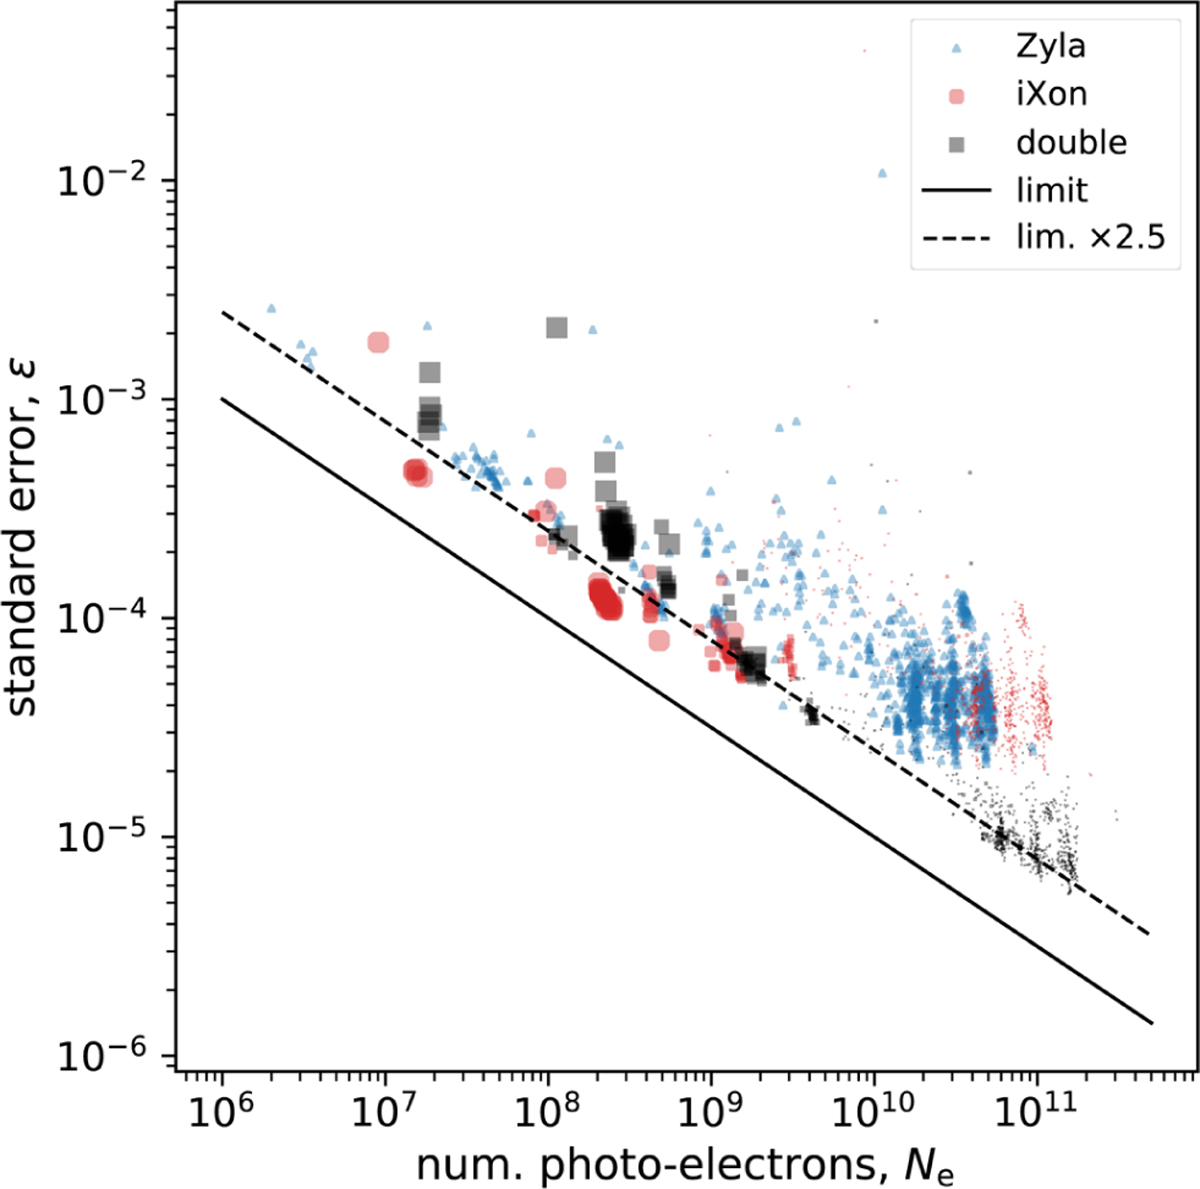
Standard errors (ϵ) of ![]() , and
, and ![]() measured for different standard stars plotted against numbers of detected photo-electrons (Ne). Blue triangles represent measurements using the Zyla data only (single-ratio method). Red circles are the same as the blue triangles except they are using the iXon data. Black squares denote measurements using the double-ratio method. A single symbol is from one take. In most cases, one take consists of 30 000 frames (Δt = 150 s). All the observations were conducted with 200 fps. The size of the red circles and the black squares represents the EM gain applied to iXon observations; the smallest and largest symbols correspond to gain factors of ×1 (no gain) and ×100, respectively. The solid line displays the photon noise limit, which is
measured for different standard stars plotted against numbers of detected photo-electrons (Ne). Blue triangles represent measurements using the Zyla data only (single-ratio method). Red circles are the same as the blue triangles except they are using the iXon data. Black squares denote measurements using the double-ratio method. A single symbol is from one take. In most cases, one take consists of 30 000 frames (Δt = 150 s). All the observations were conducted with 200 fps. The size of the red circles and the black squares represents the EM gain applied to iXon observations; the smallest and largest symbols correspond to gain factors of ×1 (no gain) and ×100, respectively. The solid line displays the photon noise limit, which is ![]() . The dashed line is 2.5 times the limit.
. The dashed line is 2.5 times the limit.
Current usage metrics show cumulative count of Article Views (full-text article views including HTML views, PDF and ePub downloads, according to the available data) and Abstracts Views on Vision4Press platform.
Data correspond to usage on the plateform after 2015. The current usage metrics is available 48-96 hours after online publication and is updated daily on week days.
Initial download of the metrics may take a while.