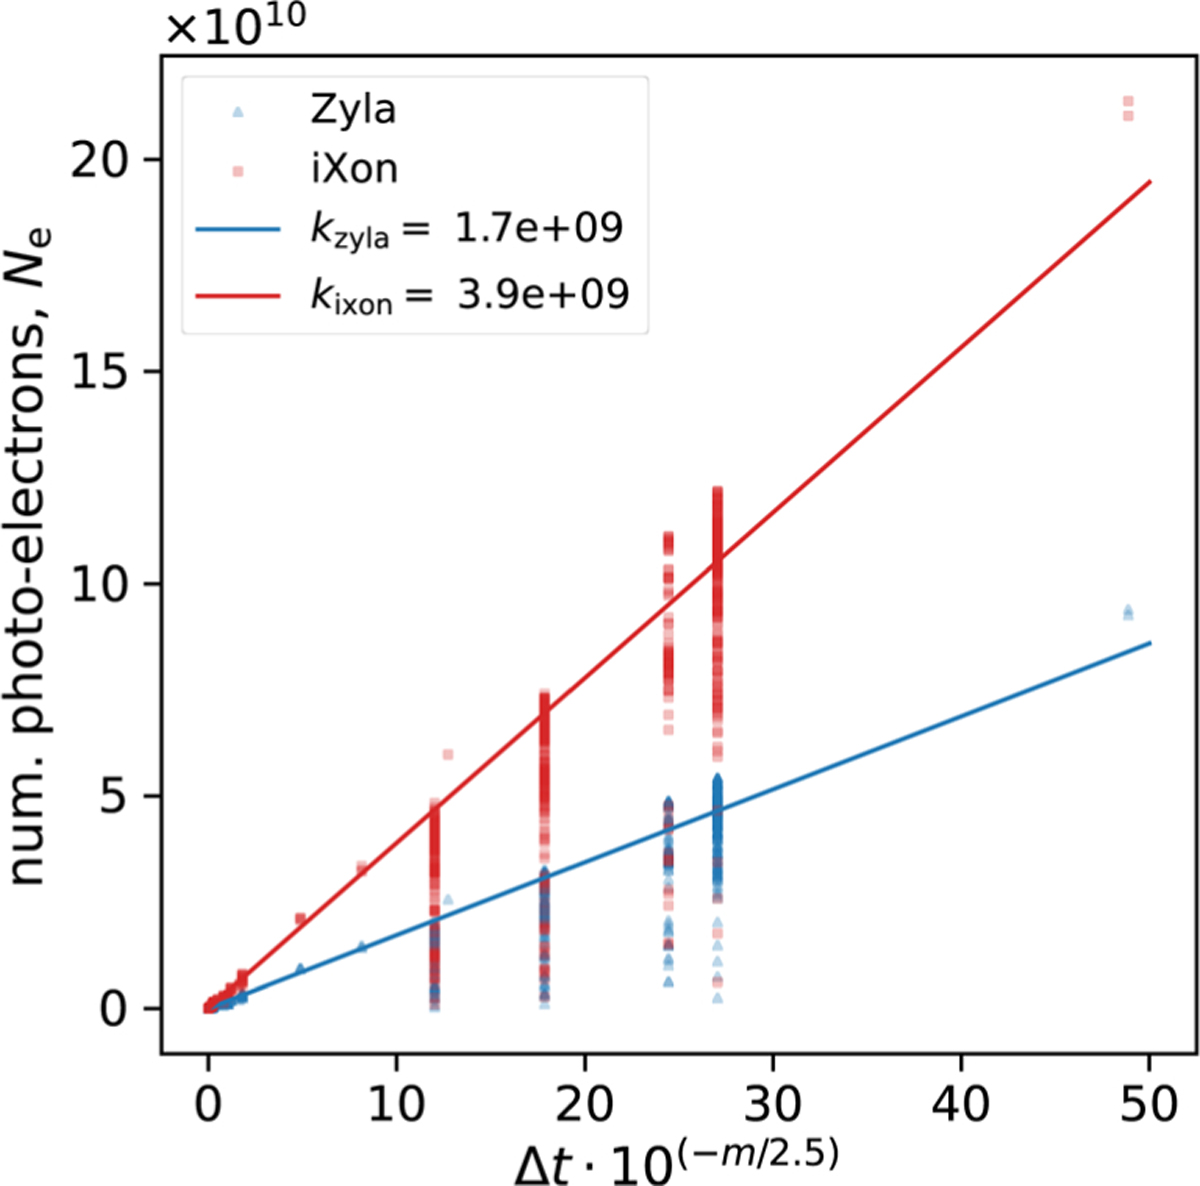
Fig. 5
Download original image
Relationship among Ne, Δt, and m. Blue triangles and red circles represent the data captured with Zyla and iXon, respectively. The lines fitted using Eq. (9) are drawn separately for the Zyla and iXon data. The data points at a certain x (= Δt · 10−m/2.5) exhibit a vertical scatter depending on the atmospheric clearness. To avoid underestimating k, the fitting was performed considering Ne/x as weights. The lower k for Zyla than iXon is presumably owing to the shorter effective exposure time of Zyla (~3.4 ms for Zyala vs ~4.8 ms for iXon) and the lower quantum efficiency of Zyla (~80% for Zyla vs ~95% for iXon at the wavelength of ~650 nm).
Current usage metrics show cumulative count of Article Views (full-text article views including HTML views, PDF and ePub downloads, according to the available data) and Abstracts Views on Vision4Press platform.
Data correspond to usage on the plateform after 2015. The current usage metrics is available 48-96 hours after online publication and is updated daily on week days.
Initial download of the metrics may take a while.