Fig. 7
Download original image
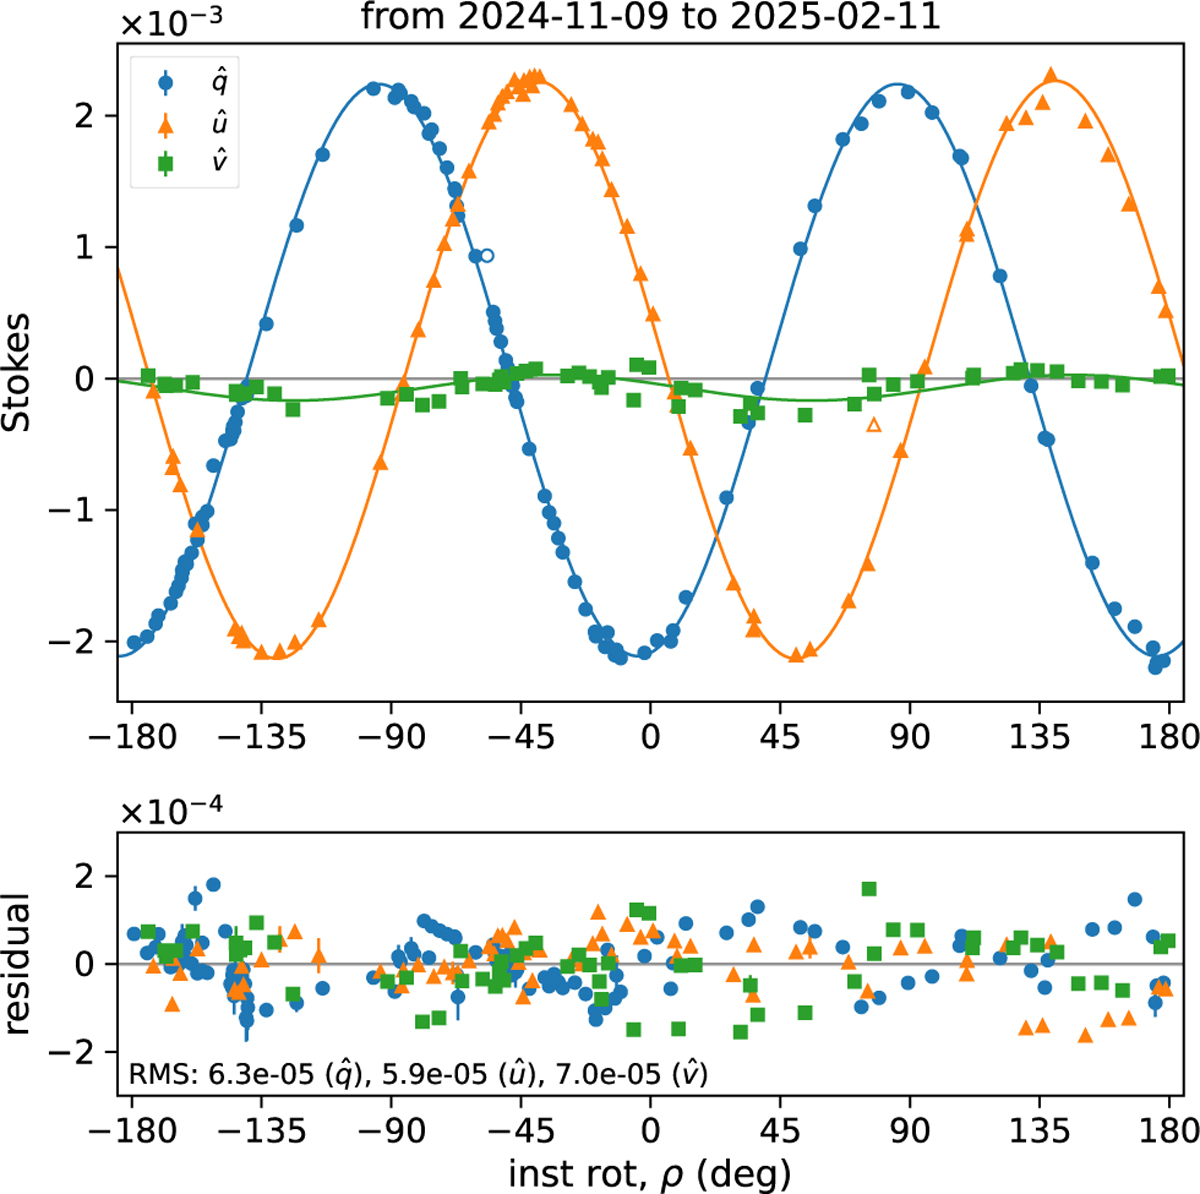
Observations of UP stars. Upper: raw Stokes values plotted against angles of the instrumental rotator (ρ). Blue circles, orange triangles, and green squares represent ![]() , and
, and ![]() , respectively. Fit curves in the form of Eq. (12) are also displayed. The data points shown as open plots are excluded from the fitting. The parameters of the fit curves are summarized in Table 2. Lower: differences between the raw Stokes values and the fit curves. The RMS values are written at a corner.
, respectively. Fit curves in the form of Eq. (12) are also displayed. The data points shown as open plots are excluded from the fitting. The parameters of the fit curves are summarized in Table 2. Lower: differences between the raw Stokes values and the fit curves. The RMS values are written at a corner.
Current usage metrics show cumulative count of Article Views (full-text article views including HTML views, PDF and ePub downloads, according to the available data) and Abstracts Views on Vision4Press platform.
Data correspond to usage on the plateform after 2015. The current usage metrics is available 48-96 hours after online publication and is updated daily on week days.
Initial download of the metrics may take a while.