Fig. 8
Download original image
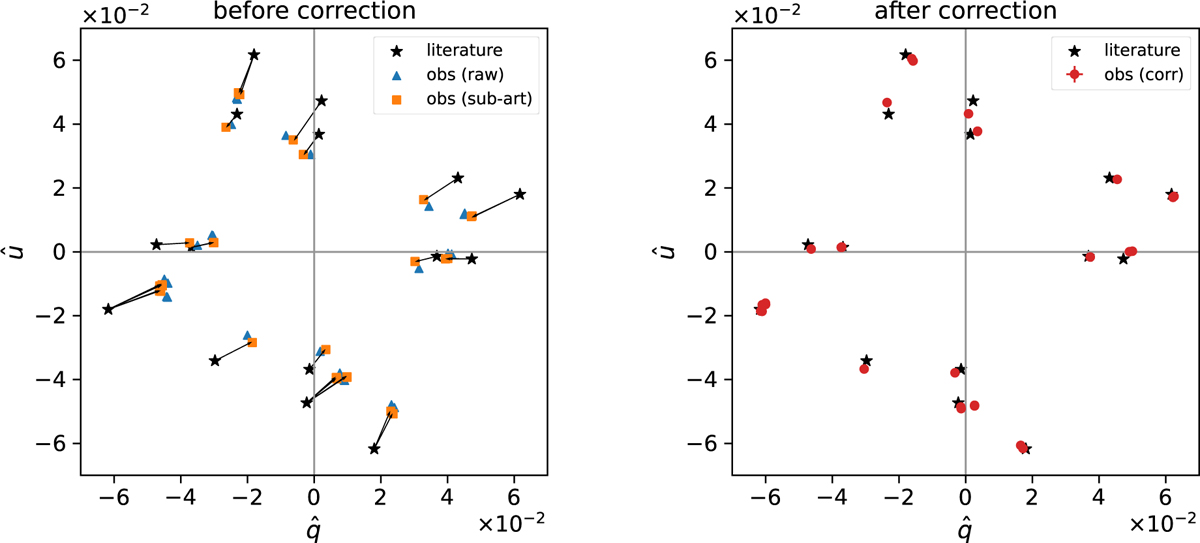
Observed (![]() ) before correction (left) and after correction (right) in comparison with values in the literature (Schmidt et al. 1992). Blue triangles, orange squares, and red circles represent raw Stokes (
) before correction (left) and after correction (right) in comparison with values in the literature (Schmidt et al. 1992). Blue triangles, orange squares, and red circles represent raw Stokes (![]() ), Stokes after subtraction of artificial polarization (
), Stokes after subtraction of artificial polarization (![]() ), and response-corrected Stokes
), and response-corrected Stokes ![]() , respectively. The star-shaped plots are from the literature.
, respectively. The star-shaped plots are from the literature.
Current usage metrics show cumulative count of Article Views (full-text article views including HTML views, PDF and ePub downloads, according to the available data) and Abstracts Views on Vision4Press platform.
Data correspond to usage on the plateform after 2015. The current usage metrics is available 48-96 hours after online publication and is updated daily on week days.
Initial download of the metrics may take a while.