Fig. 9
Download original image
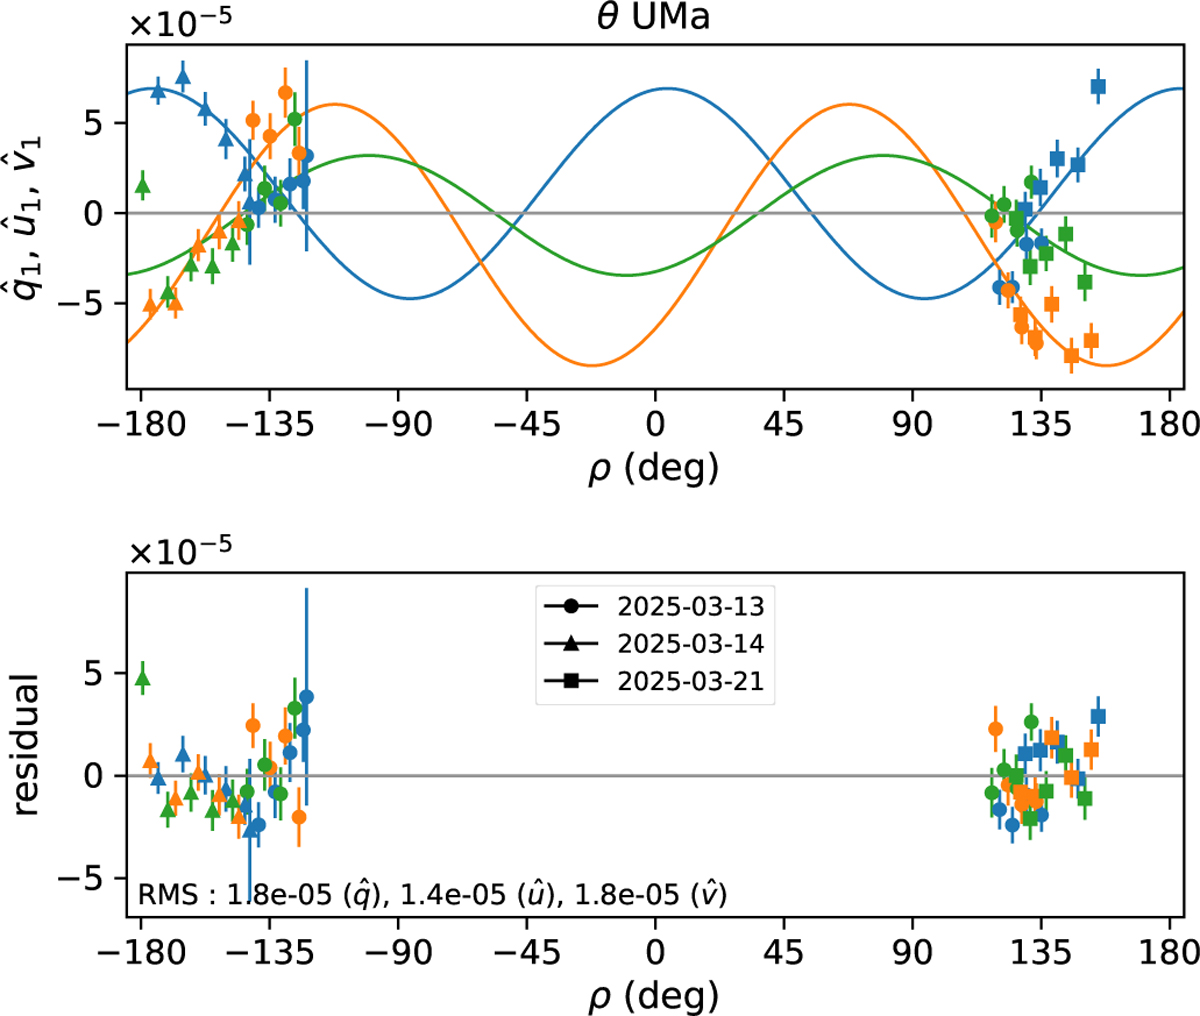
Observed Stokes values of θ UMa. Upper: Stokes values after subtraction of the artificial polarization. The colors represent each of Stokes: ![]() (blue),
(blue), ![]() (orange), and
(orange), and ![]() (green). The shapes of the plots correspond to observation dates as explained in the lower panel. Fit curves in the form of Eq. (12) are also drawn. Lower: differences between the observed values
(green). The shapes of the plots correspond to observation dates as explained in the lower panel. Fit curves in the form of Eq. (12) are also drawn. Lower: differences between the observed values ![]() and the fit curves.
and the fit curves.
Current usage metrics show cumulative count of Article Views (full-text article views including HTML views, PDF and ePub downloads, according to the available data) and Abstracts Views on Vision4Press platform.
Data correspond to usage on the plateform after 2015. The current usage metrics is available 48-96 hours after online publication and is updated daily on week days.
Initial download of the metrics may take a while.