Open Access
Fig. 1.
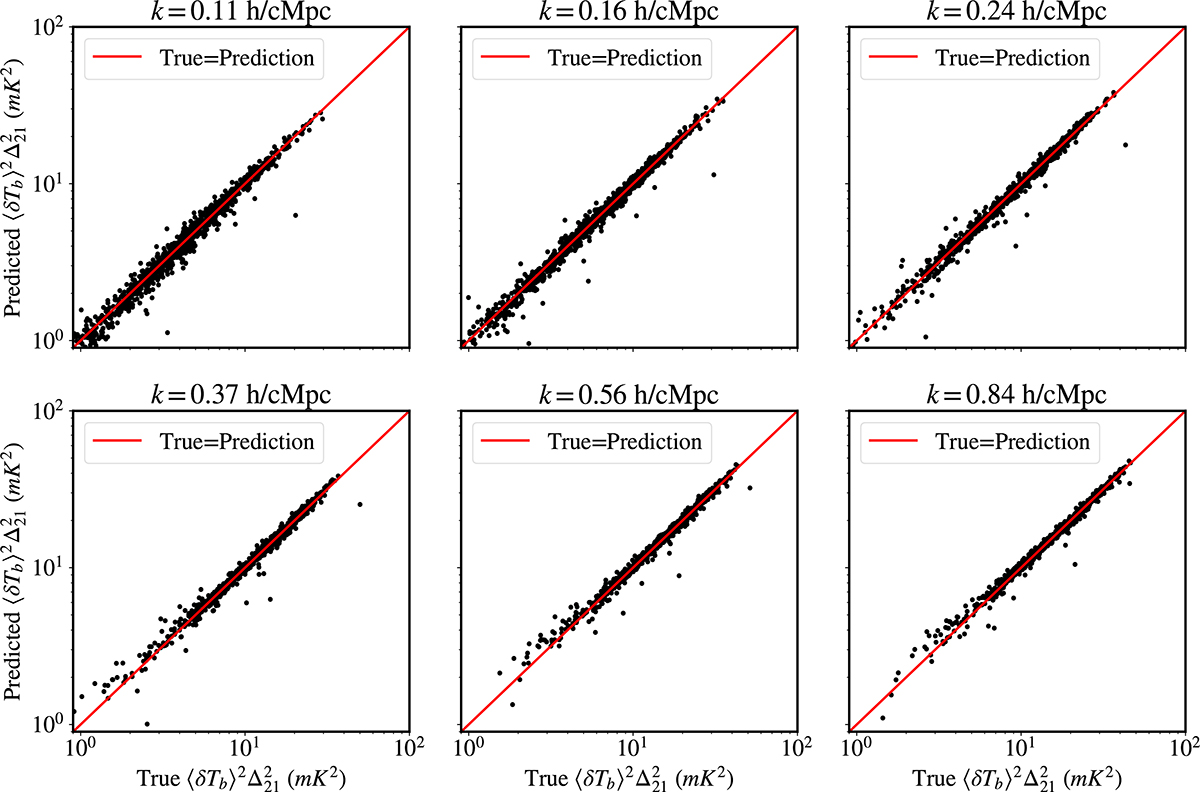
Download original image
Comparison of true 21 cm power spectrum and corresponding predicted estimates using ANN at different k bins used in this work. The black points correspond to test dataset, while the red line signifies True = Prediction. The corresponding R2 value is 0.98.
Current usage metrics show cumulative count of Article Views (full-text article views including HTML views, PDF and ePub downloads, according to the available data) and Abstracts Views on Vision4Press platform.
Data correspond to usage on the plateform after 2015. The current usage metrics is available 48-96 hours after online publication and is updated daily on week days.
Initial download of the metrics may take a while.