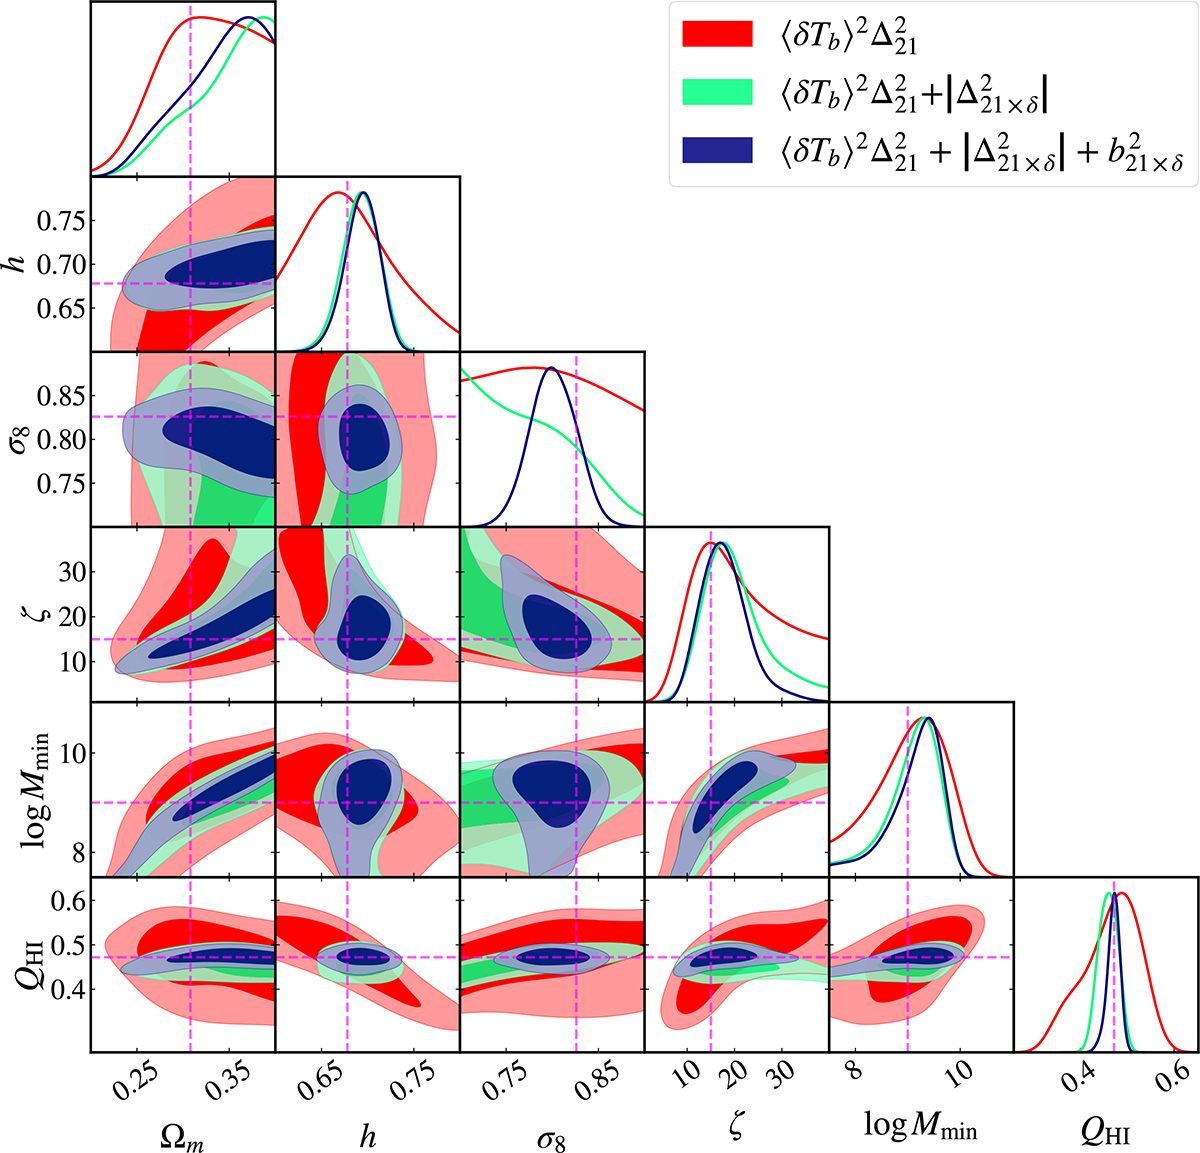
Fig. 7.
Download original image
Comparison of posterior distributions using different combinations of observables i.e. only 21 cm power spectra (red), 21 cm power spectra + 21 cm-density cross-power spectra (green), and adding bias of cross-spectra (blue). The diagonal panels show the 1D posterior probability distribution, and the off diagonal panels show the joint 2D posteriors. The contours represent the 68% and 95% confidence intervals. The dashed line represents the input parameter values used to generate the mock dataset. The observational uncertainties are assumed to be 5% of the observable amplitudes in this case.
Current usage metrics show cumulative count of Article Views (full-text article views including HTML views, PDF and ePub downloads, according to the available data) and Abstracts Views on Vision4Press platform.
Data correspond to usage on the plateform after 2015. The current usage metrics is available 48-96 hours after online publication and is updated daily on week days.
Initial download of the metrics may take a while.