Fig. 1.
Download original image
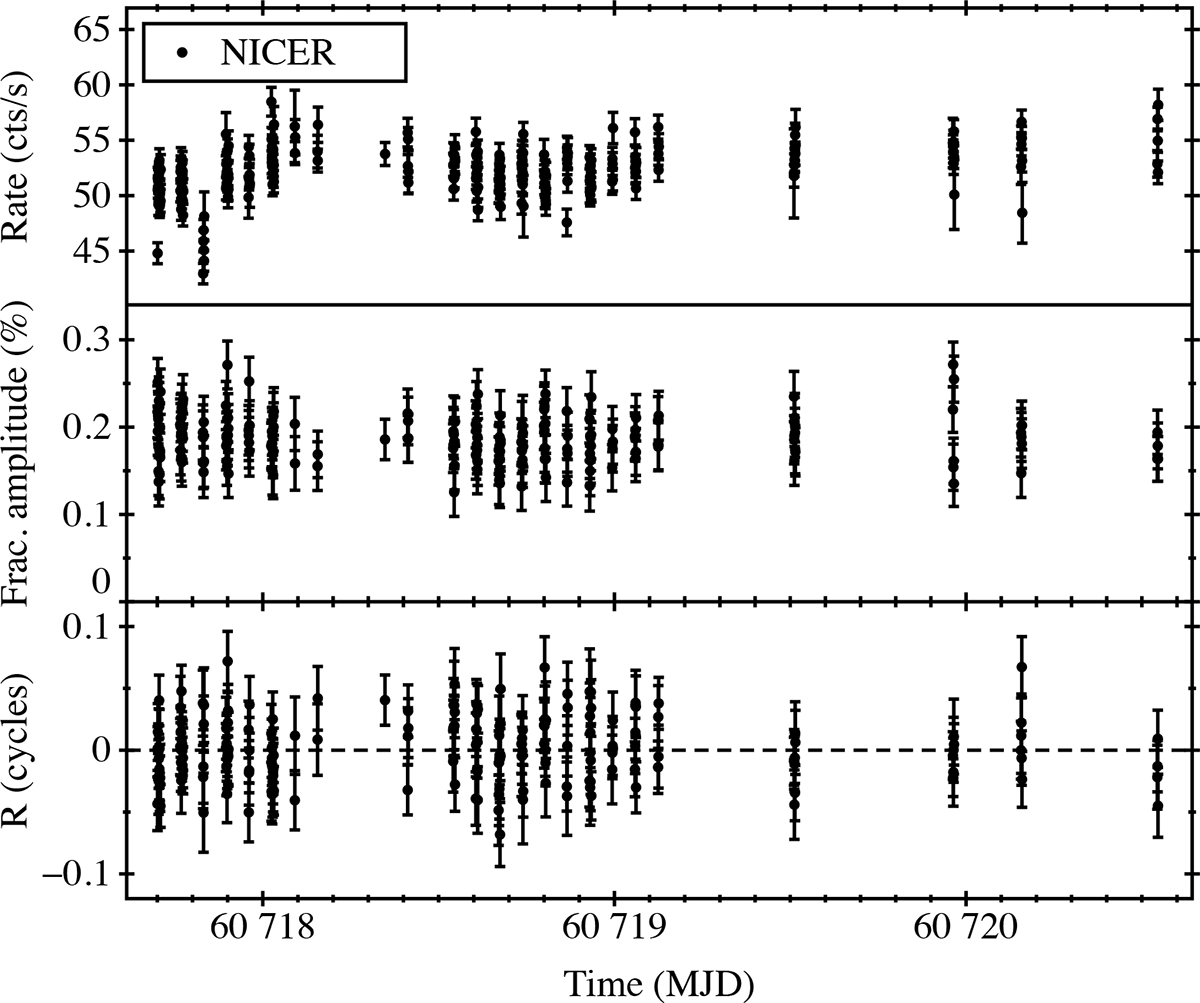
Top panel: NICER 0.3–10 keV light curve of IGR J17511−3057 during the latest outburst starting from February 11, 2025 (MJD 60717.7). The count rate is estimated by collecting 50 s of exposure time. Middle panel: Temporal evolution of the fractional amplitude of the sinusoidal component used to model the source pulse profiles. Bottom panel: Pulse phase residuals in units of phase cycles relative to the best-fitting solution.
Current usage metrics show cumulative count of Article Views (full-text article views including HTML views, PDF and ePub downloads, according to the available data) and Abstracts Views on Vision4Press platform.
Data correspond to usage on the plateform after 2015. The current usage metrics is available 48-96 hours after online publication and is updated daily on week days.
Initial download of the metrics may take a while.