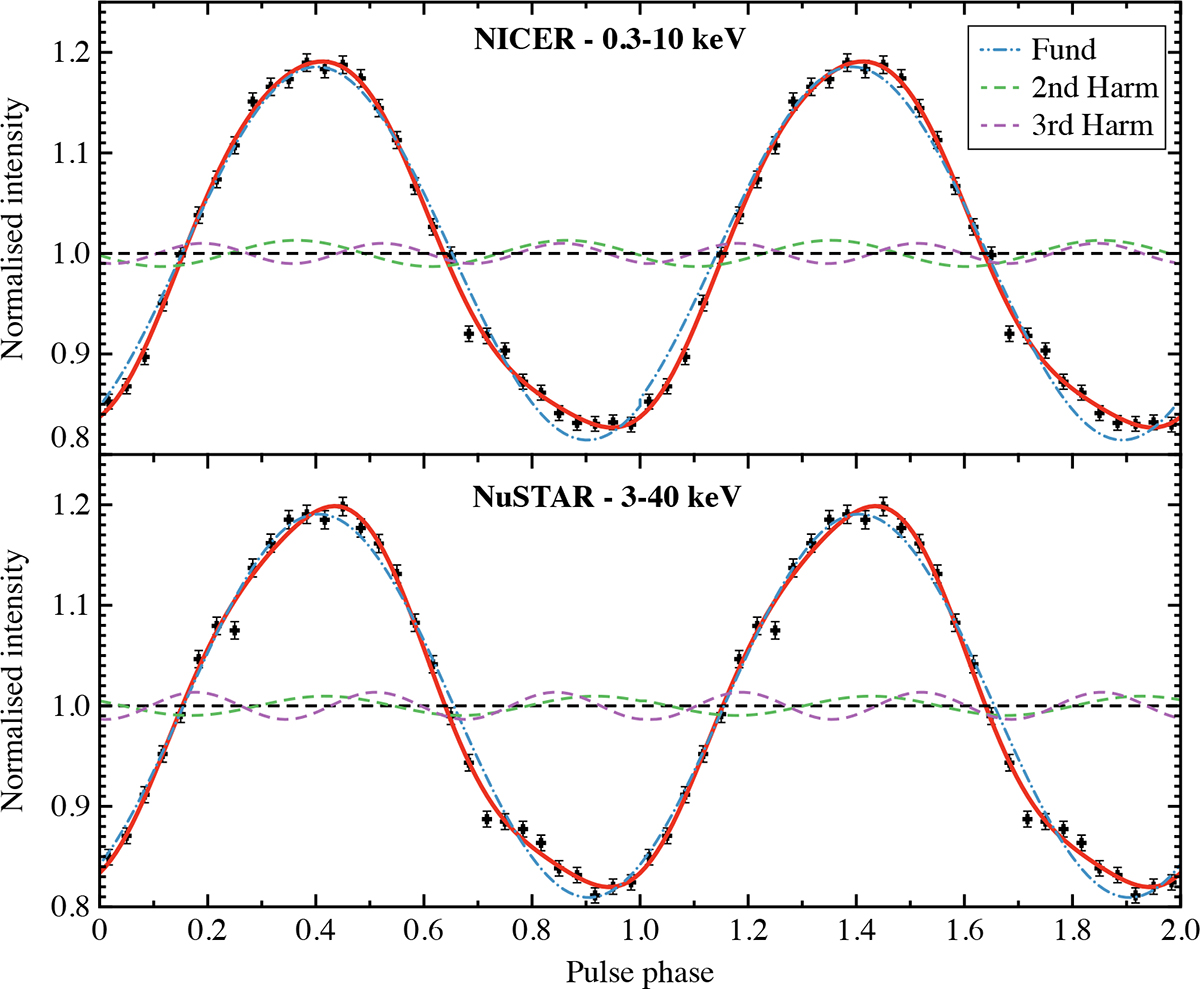
Fig. 3.
Download original image
NICER 0.3–10 keV average pulse profiles (top) and 3–40 keV average pulse profiles (bottom) of IGR J17511−3057 generated by folding at the best-fit timing solution reported in Table 1. For both profiles, the best-fitting models (red solid lines) are the superposition of up to three harmonically related sinusoidal components represented in light blue, green, and purple from smaller to higher order, respectively. Two cycles of the pulse profile are shown for clarity.
Current usage metrics show cumulative count of Article Views (full-text article views including HTML views, PDF and ePub downloads, according to the available data) and Abstracts Views on Vision4Press platform.
Data correspond to usage on the plateform after 2015. The current usage metrics is available 48-96 hours after online publication and is updated daily on week days.
Initial download of the metrics may take a while.