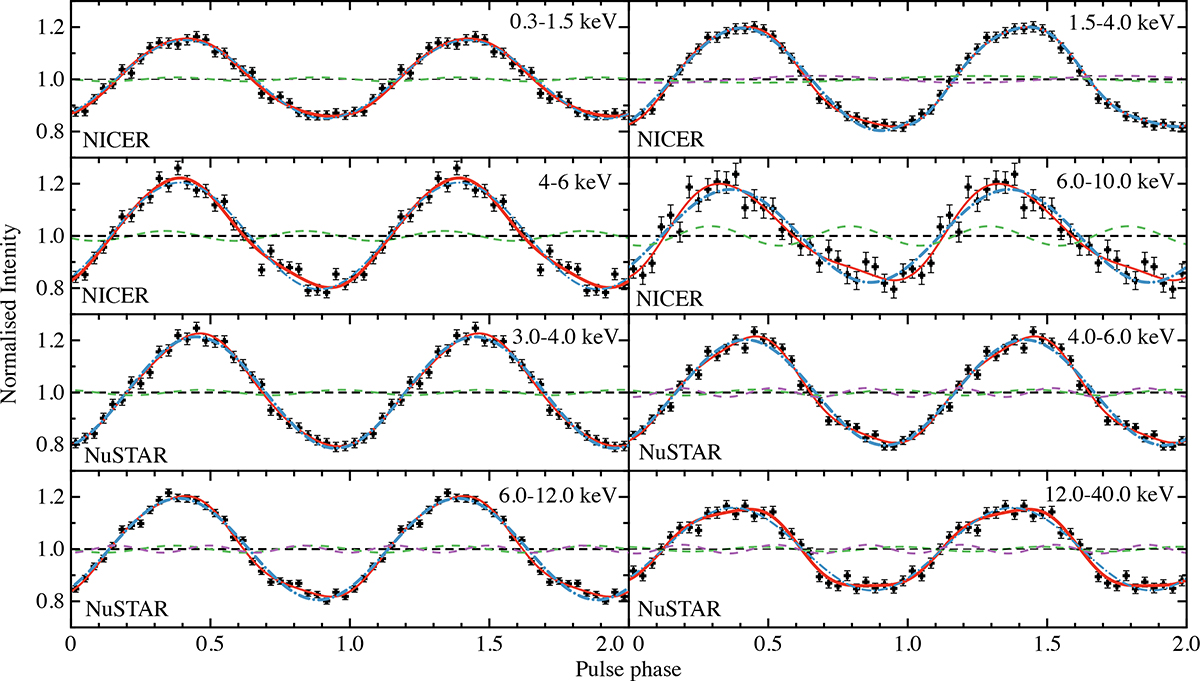
Fig. 4.
Download original image
Evolution of the NICER and NuSTAR pulse profiles of IGR J17511−3057 as a function of energy. Pulse profiles are generated by folding at different energy ranges after correcting the photon time-of-arrival for the most updated binary ephemerides reported in Table 1. The best-fitting models (red solid lines) are the superposition of up to two harmonically related sinusoidal components. Two cycles of the pulse profile are shown for clarity. The color-coding follows the convention described in Fig. 3.
Current usage metrics show cumulative count of Article Views (full-text article views including HTML views, PDF and ePub downloads, according to the available data) and Abstracts Views on Vision4Press platform.
Data correspond to usage on the plateform after 2015. The current usage metrics is available 48-96 hours after online publication and is updated daily on week days.
Initial download of the metrics may take a while.