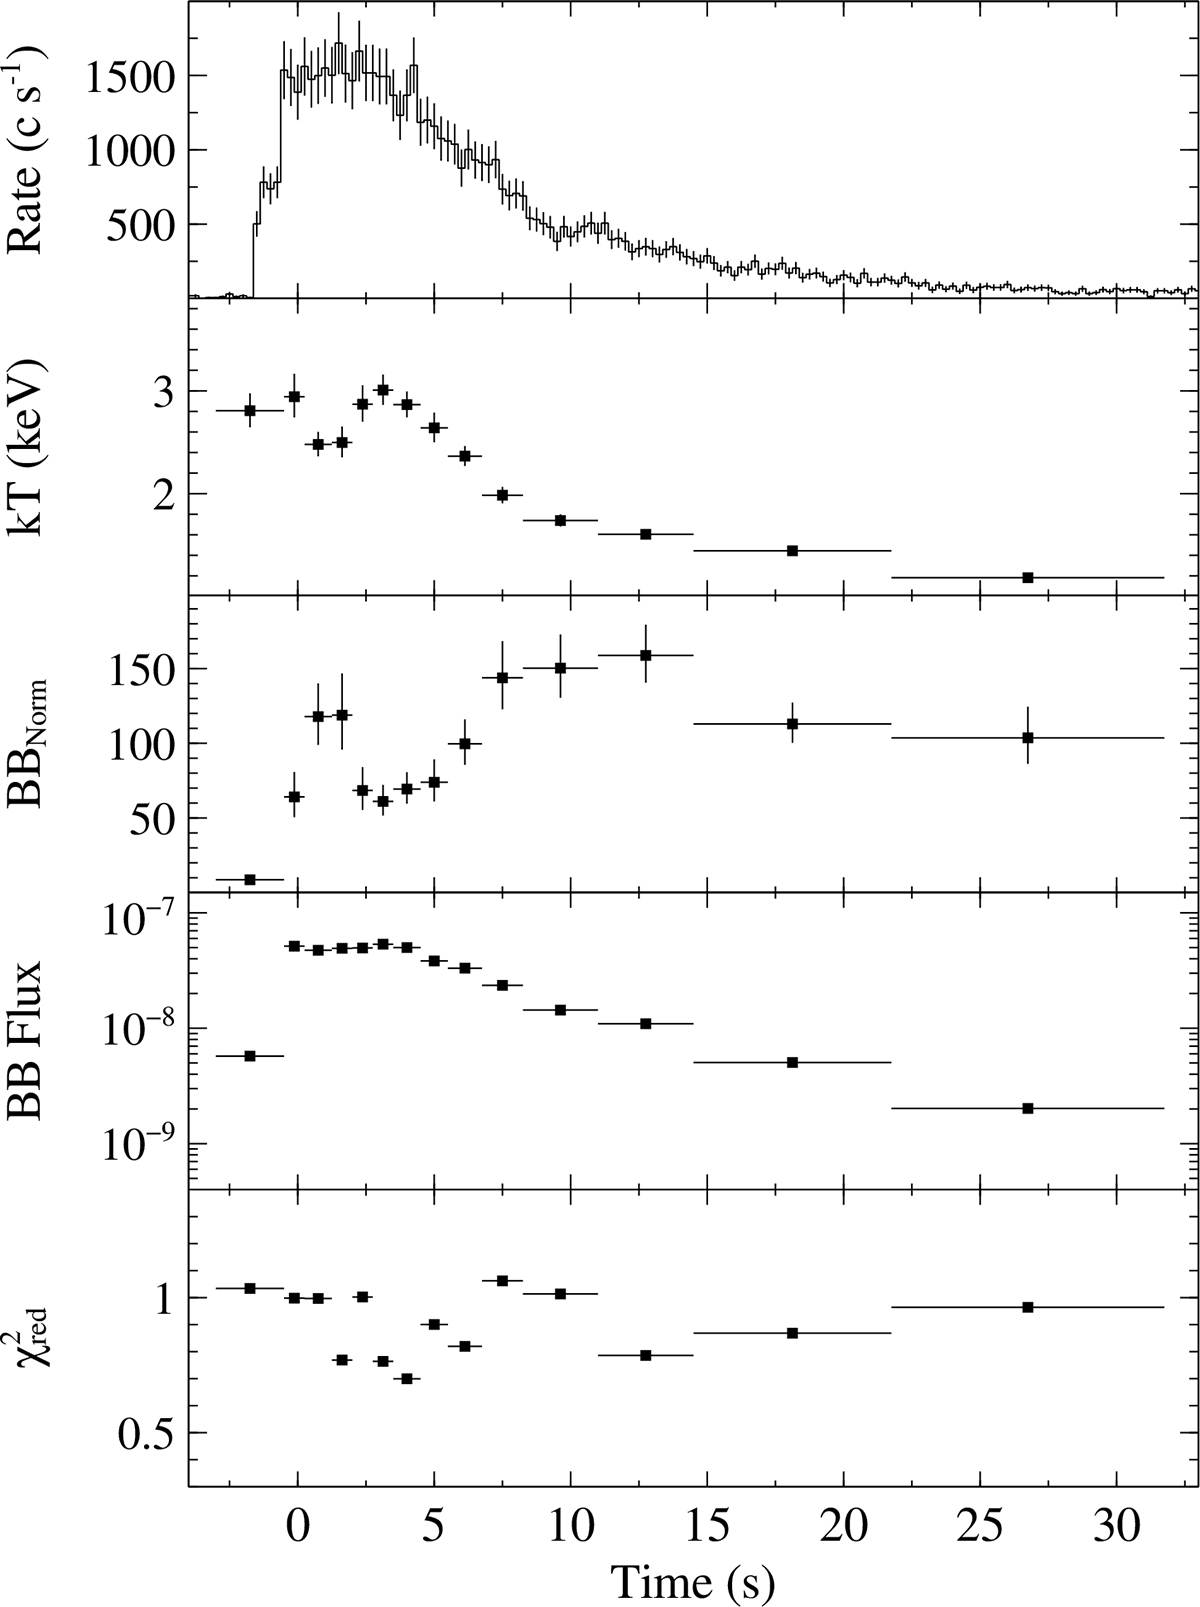
Fig. 7.
Download original image
Burst time-resolved spectral parameters. The top panel shows the burst light curve in the 3–79 keV range. The blackbody temperature (kT) and its normalization (BBNorm) are shown in the second and third panels. The bolometric blackbody flux in the 0.1–100 keV range is presented in the fourth panel in the unit of erg s−1 cm−2, whereas the fifth panel shows the value of χred2 from the fit.
Current usage metrics show cumulative count of Article Views (full-text article views including HTML views, PDF and ePub downloads, according to the available data) and Abstracts Views on Vision4Press platform.
Data correspond to usage on the plateform after 2015. The current usage metrics is available 48-96 hours after online publication and is updated daily on week days.
Initial download of the metrics may take a while.