Fig. 10.
Download original image
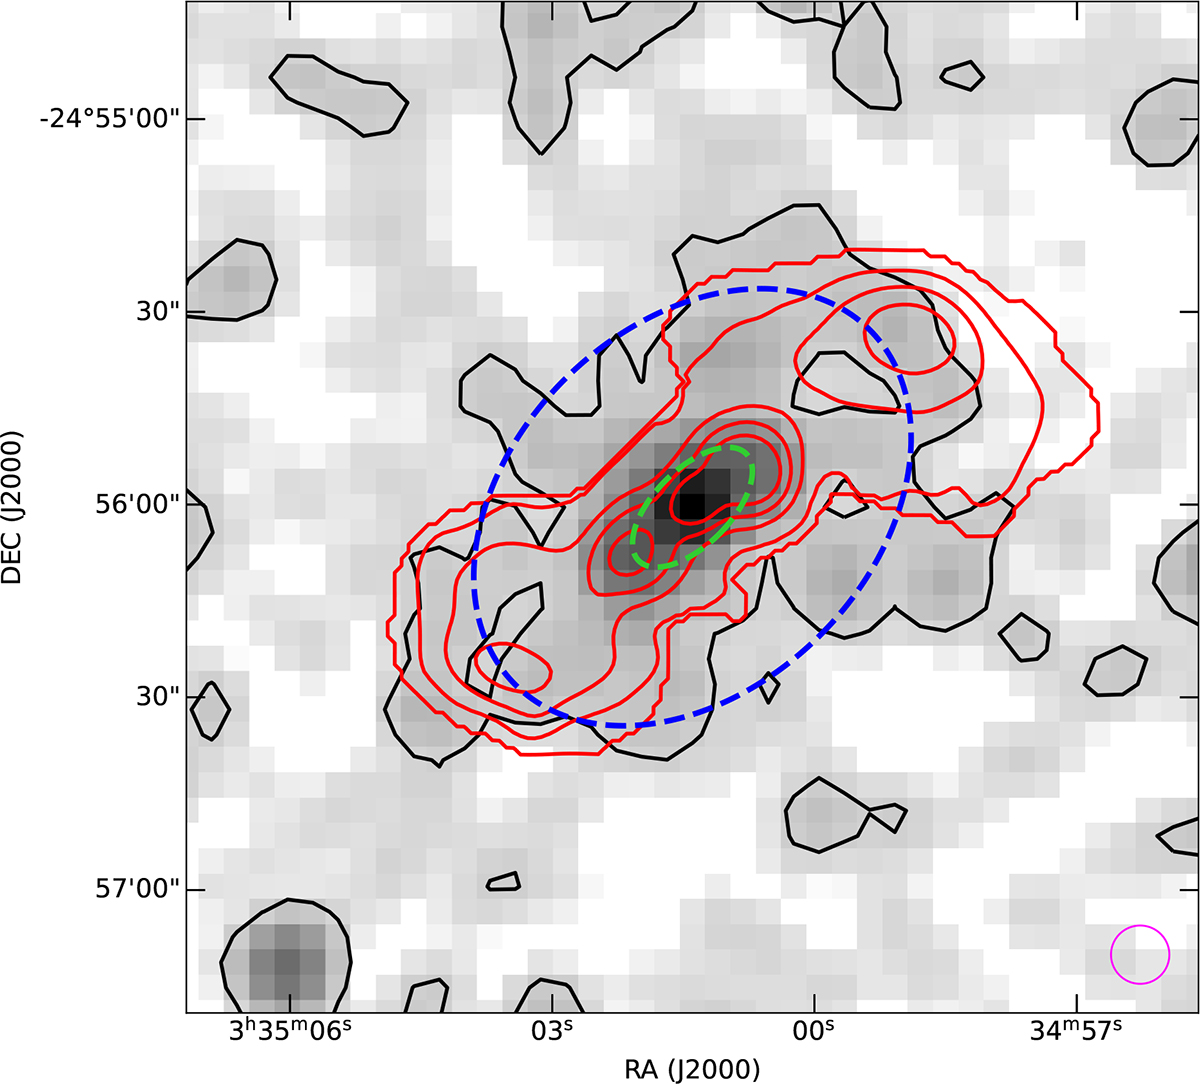
Chandra X-ray image of NGC 1371. The X-ray emission has been smoothed with a Gaussian 1 kpc × 1 kpc kernel (given in the bottom right corner) to enhance the faint emission. The black contour denotes the 3σ level of the smoothed X-ray image. The red contours refers to the radio continuum (levels: 0.08, 0.31, 0.80, 1.68 mJy beam−1, where the beam is 7.4″ × 6.7″). The dashed green and blue ellipses correspond to the extraction regions of the X-ray spectra studied by Hughes et al. (2007).
Current usage metrics show cumulative count of Article Views (full-text article views including HTML views, PDF and ePub downloads, according to the available data) and Abstracts Views on Vision4Press platform.
Data correspond to usage on the plateform after 2015. The current usage metrics is available 48-96 hours after online publication and is updated daily on week days.
Initial download of the metrics may take a while.