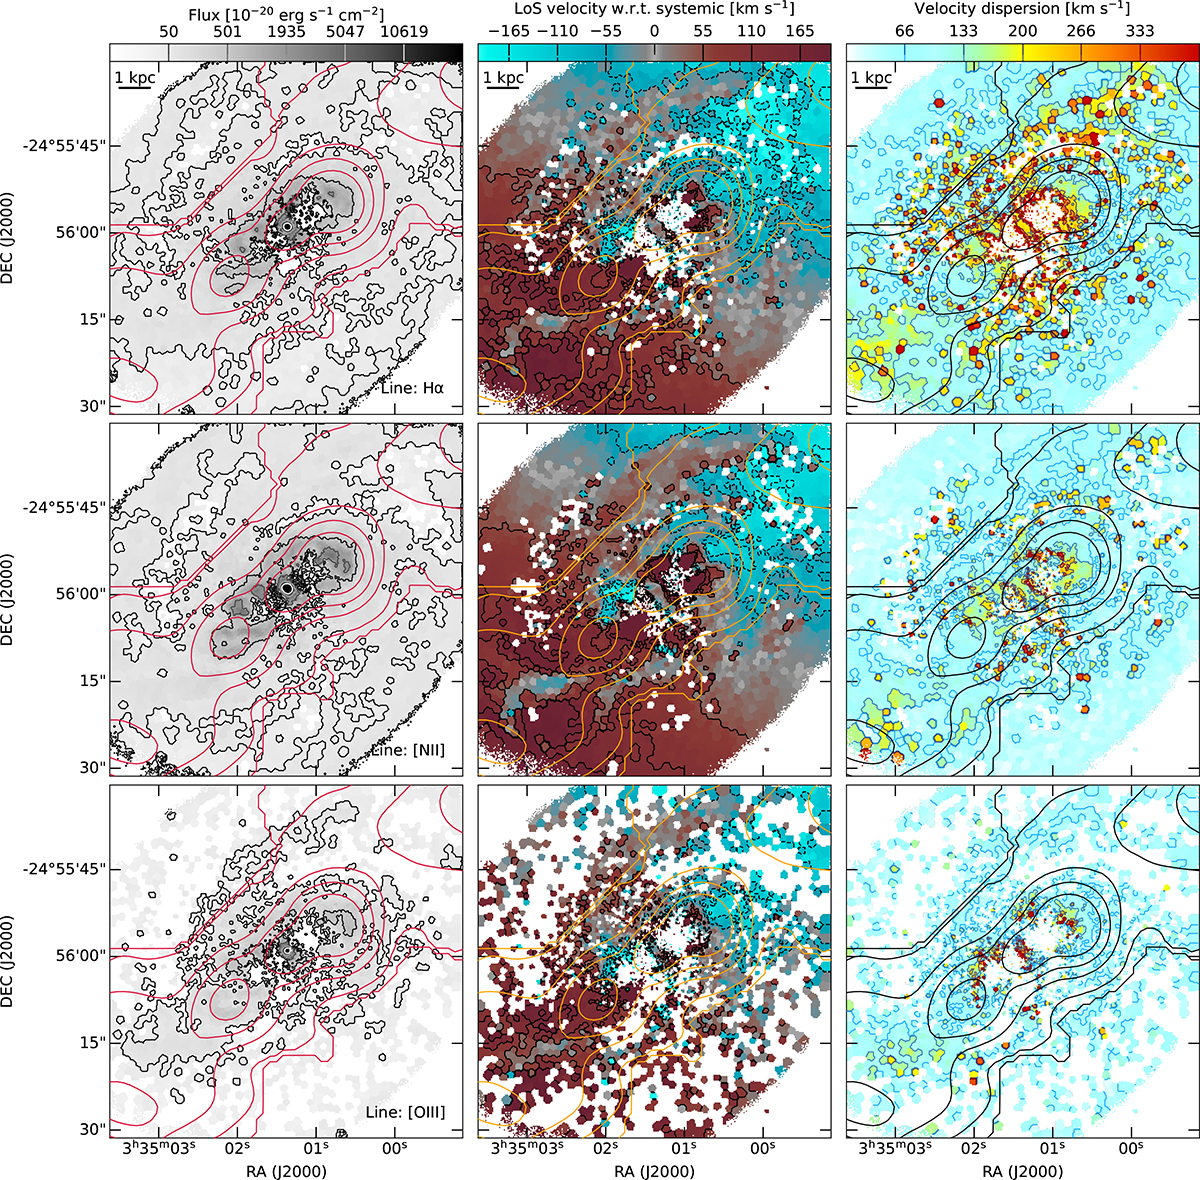
Fig. 11.
Download original image
Ionised gas moment maps. Left columns: Intensity map in grey-scale from faint (grey) to bright (black) of the Hα, [NII] and [OIII] lines (from top to bottom). The contour levels for the intensity map are given in the colour bar at the top. The red contours refer to the radio continuum (levels: 0.08, 0.31, 0.80, 1.68 mJy beam−1). Central columns: Peak-velocity field with respect to the systemic velocity (1456.4 km s−1). The dashed contours refer to the approaching side, while the solid lines correspond to receding velocities. The radio continuum is overlaid with orange contours. Right panels: Velocity dispersion map of the aforementioned lines. The contour levels are given in the colour bar. The black contours refer to the radio continuum. In all the top panels the 1 kpc reference scale is shown at the top left.
Current usage metrics show cumulative count of Article Views (full-text article views including HTML views, PDF and ePub downloads, according to the available data) and Abstracts Views on Vision4Press platform.
Data correspond to usage on the plateform after 2015. The current usage metrics is available 48-96 hours after online publication and is updated daily on week days.
Initial download of the metrics may take a while.