Fig. 12.
Download original image
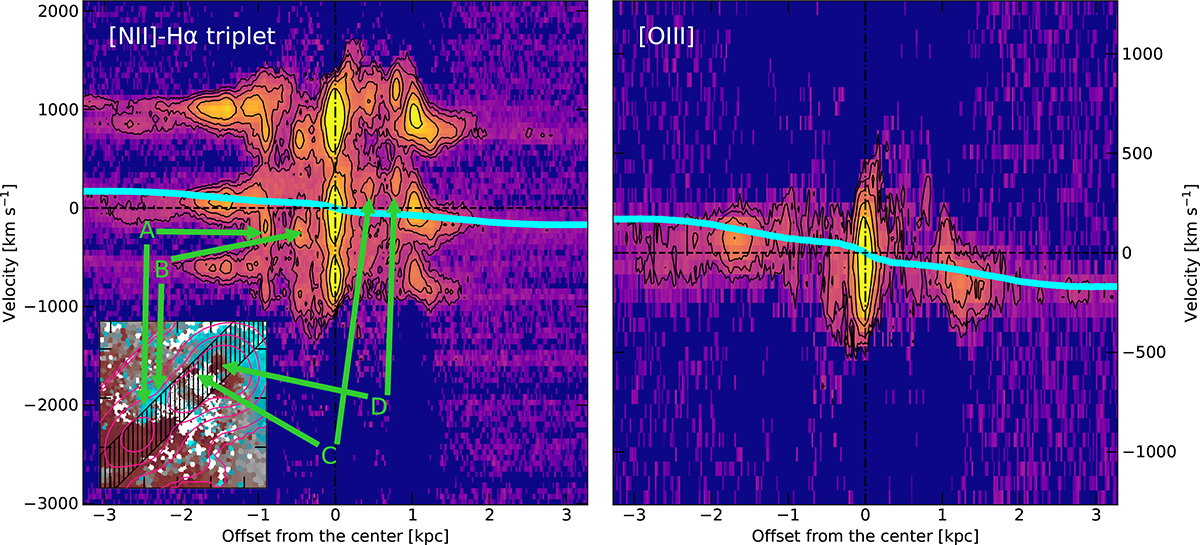
Position-velocity diagrams of the ionised gas. The left panel shows the pv diagram along the major axis (θ = 135°) of the [NII]-Hα triplet, whereas the right panel shows the pv diagram of the [OIII] line. The contours denote the (2, 4, 8, 16, 21)σ level. The dashed black horizontal line corresponds to the Hα and [OIII] systemic velocity. The cyan line corresponds to the stellar rotation curve. The inset shows the velocity field of Hα, overlaid with the radio continuum (pink contours) and the slice from which the pv is extracted (black hatched area). The arrows indicate kinematically anomalous features.
Current usage metrics show cumulative count of Article Views (full-text article views including HTML views, PDF and ePub downloads, according to the available data) and Abstracts Views on Vision4Press platform.
Data correspond to usage on the plateform after 2015. The current usage metrics is available 48-96 hours after online publication and is updated daily on week days.
Initial download of the metrics may take a while.