Fig. 13.
Download original image
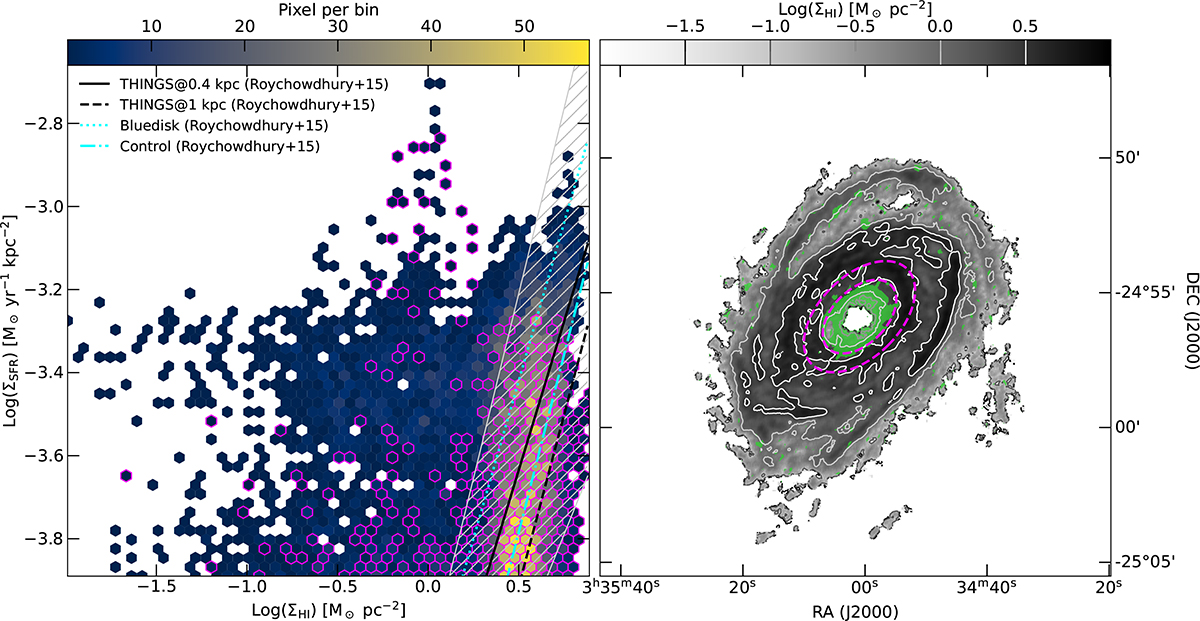
Spatially resolved Kennicutt-Schimdt law. Left panel: Density plot of ΣSFR as a function of ΣH I. The two-dimensional histogram is made of 49 × 49 hexagonal bins, each containing at least 1 pixel. The coloured lines indicate the relations found by Roychowdhury et al. (2015) for H I dominated regions in spiral galaxies; the solid and dashed black curves refer to the relation found for THINGS (Walter et al. 2008) galaxies studied at 0.4 kpc resolution (solid line) and 1 kpc resolution (dashed line); the dotted cyan line indicates the relation found for the Bluedisk sample (Wang et al. 2013); the dash-dotted line refers to the control sample used by Roychowdhury et al. (2015). The silver-hatched area indicates the ±5σ scatter of the relation relative to the THINGS galaxies at 0.4 kpc resolution. Bins with magenta edges correspond to pixels within the dashed magenta elliptical annulus in the right panel. Right panel: ΣH I map. The contour levels are given in the colour bar. The green regions indicate the location of the pixel which are in the hatched area in the left panel. The dashed magenta elliptical annulus provides the approximate location of a star-forming ring observed outside the H I hole.
Current usage metrics show cumulative count of Article Views (full-text article views including HTML views, PDF and ePub downloads, according to the available data) and Abstracts Views on Vision4Press platform.
Data correspond to usage on the plateform after 2015. The current usage metrics is available 48-96 hours after online publication and is updated daily on week days.
Initial download of the metrics may take a while.