Fig. A.3.
Download original image
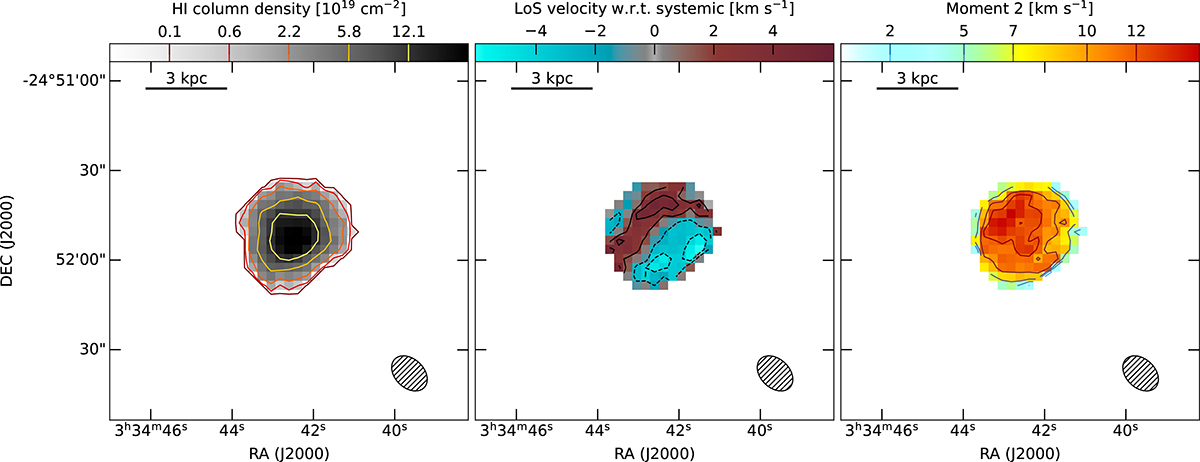
High-resolution H I moment maps of MKT 033442-245148. Left panel: Primary beam-corrected H I column-density map. Central panel: Intensity-weighted mean velocity field with respect to the systemic velocity (1647 km s−1). The dashed contours refer to the approaching side, while the solid lines correspond to receding velocities. Right panel: moment 2 map. In all panels the contour levels are given on the colour bar, while in the bottom right corner we show the 13.7″×9.6″ beam and in the top left corner the 3 kpc reference scale.
Current usage metrics show cumulative count of Article Views (full-text article views including HTML views, PDF and ePub downloads, according to the available data) and Abstracts Views on Vision4Press platform.
Data correspond to usage on the plateform after 2015. The current usage metrics is available 48-96 hours after online publication and is updated daily on week days.
Initial download of the metrics may take a while.