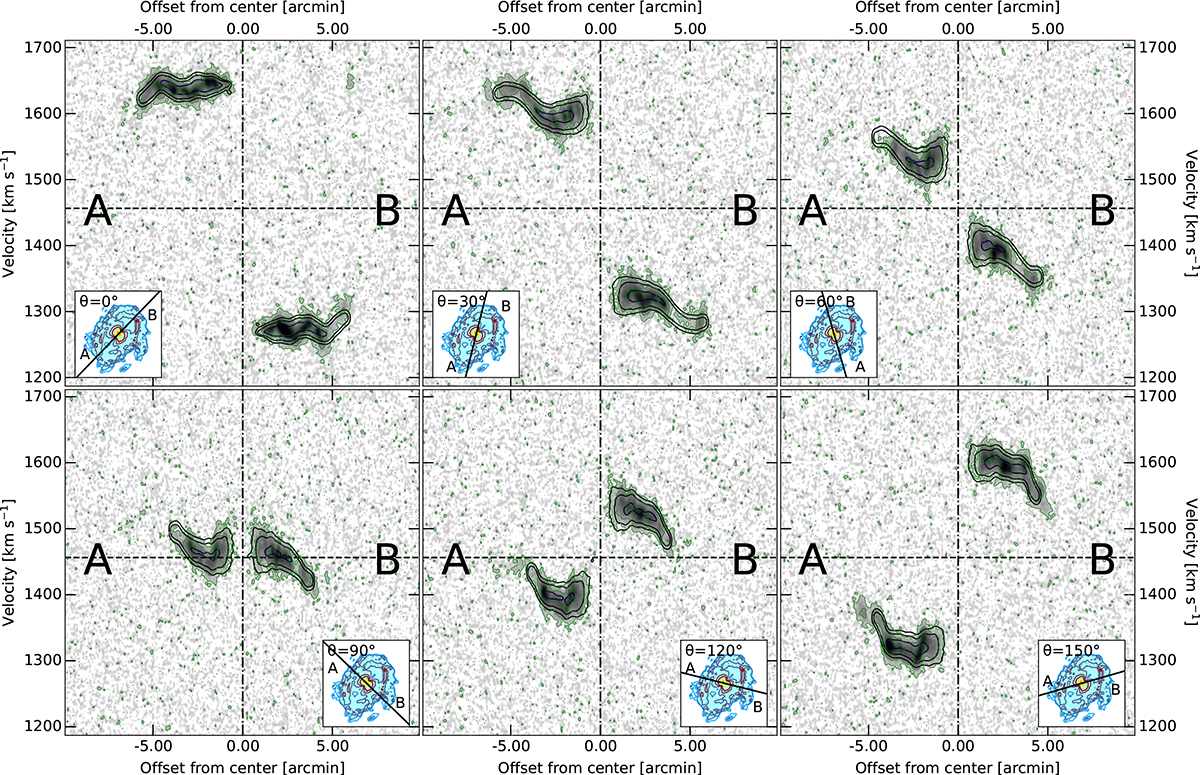
Fig. A.4.
Download original image
Low-resolution position-velocity diagrams at azimuthal angles (θ) of (0, 30, 60, 90, 120, 150) for the data and the best-fit model derived by 3D-Barolo fitting the approaching and receding side of the galaxy simultaneously. Both the data and the model cube were Hanning-smoothed at 7 km s−1. For each panel, the background grey-scale image is the slice extracted from the data cube. Solid contour levels are denoting the (4, 16, 64, 256, 1024)σ. The coloured lines refer to the model, the green curves to the data. The dashed grey contours refers to the −4σ level. The dashed black horizontal line corresponds to the systemic velocity, while the dash-dotted black vertical line denotes the 0-offset. The insets shows the moment 2 map and the slice along which the pv is extracted. The letters A and B provide the orientation in the main panels.
Current usage metrics show cumulative count of Article Views (full-text article views including HTML views, PDF and ePub downloads, according to the available data) and Abstracts Views on Vision4Press platform.
Data correspond to usage on the plateform after 2015. The current usage metrics is available 48-96 hours after online publication and is updated daily on week days.
Initial download of the metrics may take a while.