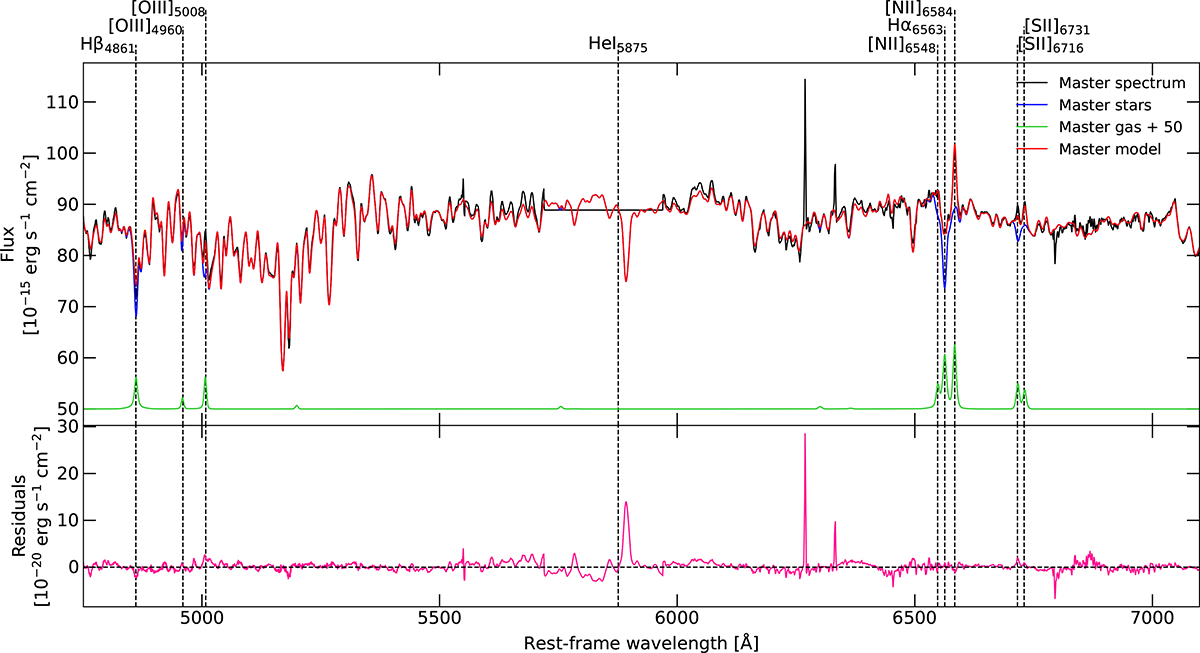
Fig. A.7.
Download original image
4750-7100Å integrated spectrum of the inner 5 kpc. The observed spectrum is reported in black, while the best-fit stellar continuum and the emission lines from the ionised gas are shown in blue and green, respectively. The model, i.e. the sum of the blue and green curves, is plotted in red. We shifted the emission lines flux up by 50 × 10−15 erg s−1 cm−2 for visualisation purposes. The bottom panel contains the residuals in terms of data−model. The observed 5775-6010Å range was originally masked because it is affected by the adaptive optics laser. The flux in these channels is set to the median value of the spectrum prior the fit. The high residual spikes around 6300Å are not real emission lines, but faulty channels.
Current usage metrics show cumulative count of Article Views (full-text article views including HTML views, PDF and ePub downloads, according to the available data) and Abstracts Views on Vision4Press platform.
Data correspond to usage on the plateform after 2015. The current usage metrics is available 48-96 hours after online publication and is updated daily on week days.
Initial download of the metrics may take a while.