Fig. A.8.
Download original image
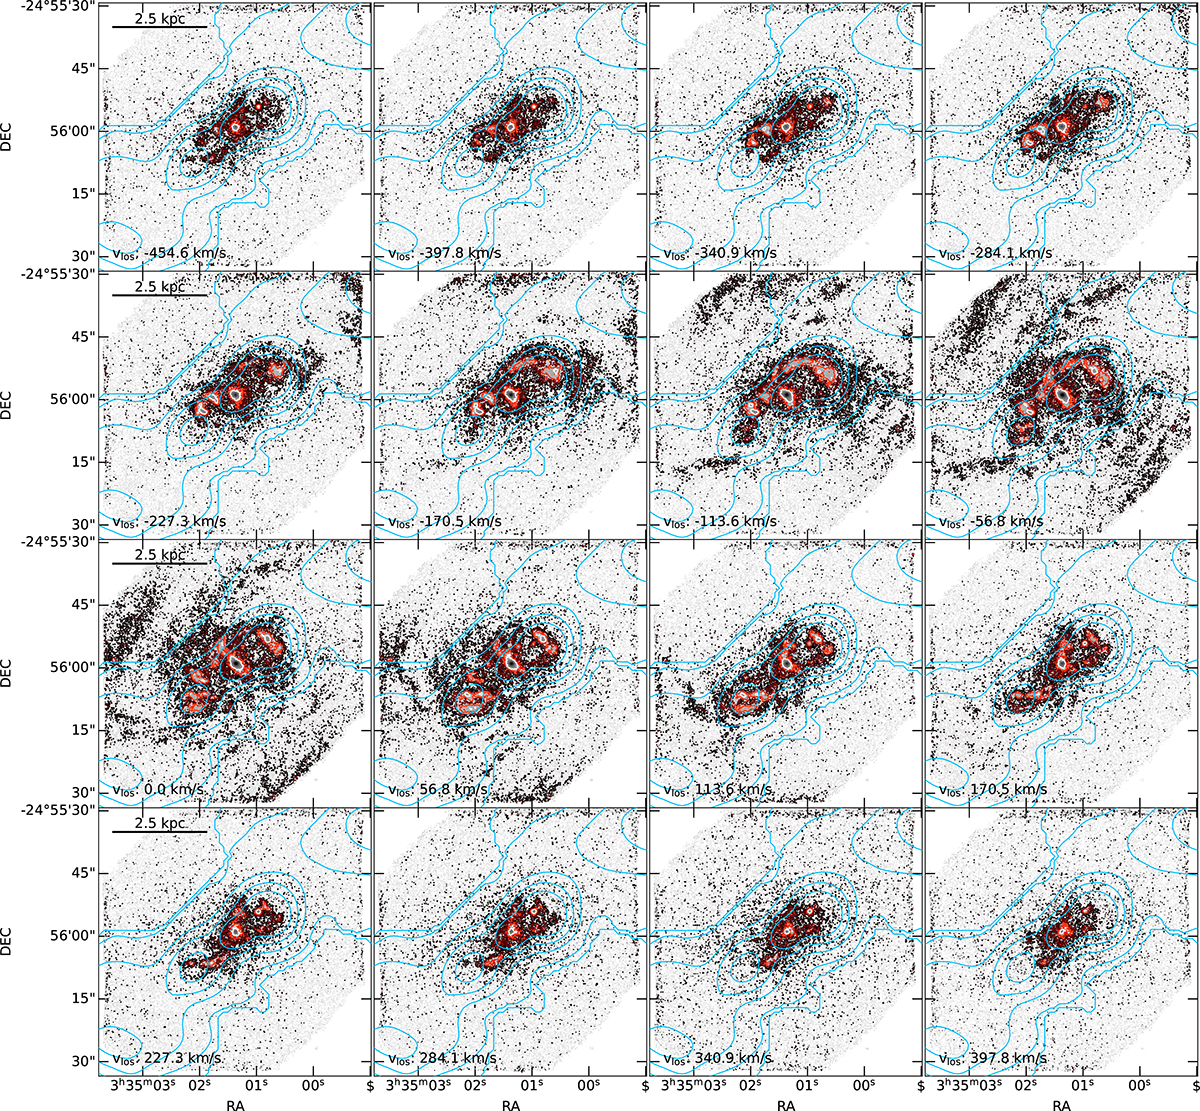
NGC 1371 Hα channel maps from −455 km s−1 to 398 km s−1 from the Hα systemic velocity in steps of 57 km s−1. The colour-scale contours correspond to flux densities of (18, 36, 73, 146) × 10-20 ergs s−1 cm−2 Å−1, equivalent to (4, 8, 16, 32)σ. The dashed grey contours denote the −4σ level. At the bottom, we report the LoS velocity (with respect to the Hα systemic velocity) in each channel and at the top left the 2.5 kpc reference scale. The blue contours in all panels indicates the radio continuum (levels: 0.08, 0.31, 0.80, 1.68 mJy beam−1)
Current usage metrics show cumulative count of Article Views (full-text article views including HTML views, PDF and ePub downloads, according to the available data) and Abstracts Views on Vision4Press platform.
Data correspond to usage on the plateform after 2015. The current usage metrics is available 48-96 hours after online publication and is updated daily on week days.
Initial download of the metrics may take a while.