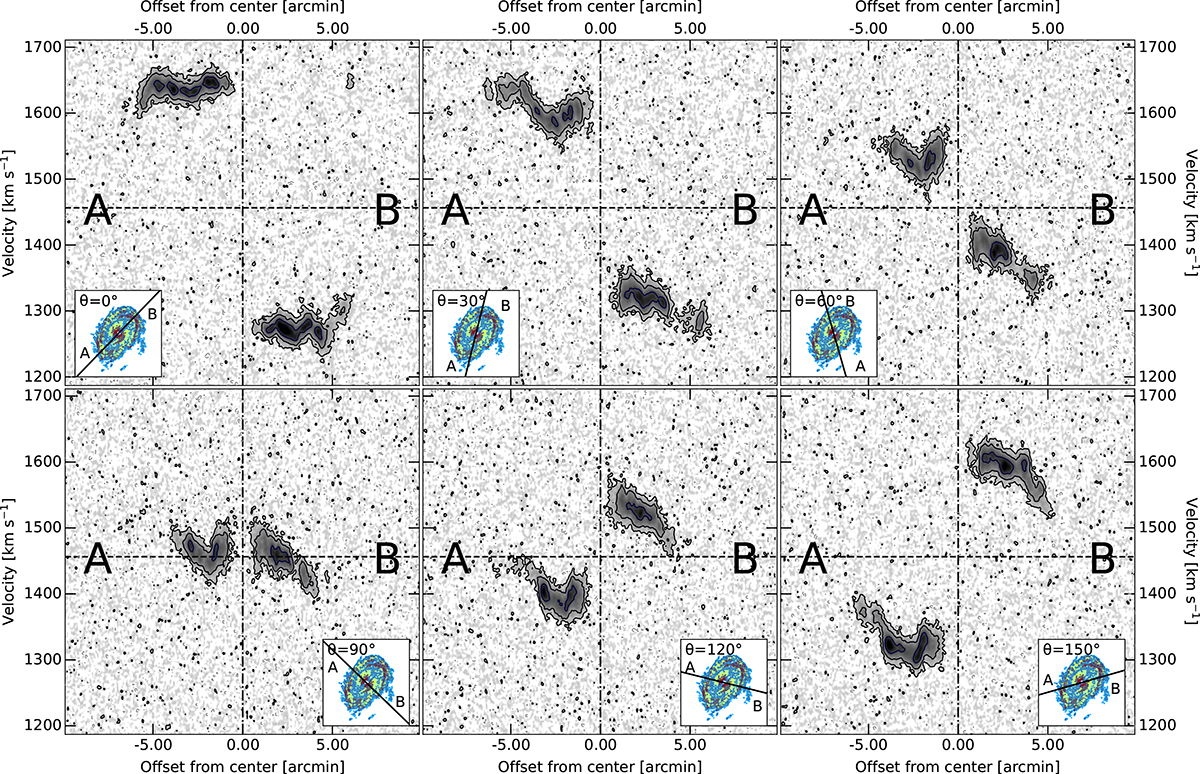
Fig. 3.
Download original image
Position-velocity diagrams at azimuthal angles (θ) of (0, 30, 60, 90, 120, 150) degrees with respect to the major axis in the plane of the sky. The data cube was spectrally smoothed with a 7 km s−1 Hanning kernel. The solid contour levels denote the (4, 16, 64, 256, 1024)σ level, where σ = 0.03 mJy beam−1. The dashed grey contours refers to the −4σ level. The dashed black horizontal line corresponds to the systemic velocity, while the dash-dotted black vertical line denotes the centre of the galaxy. The insets shows the moment 2 map and the slice along which the pv is extracted. The letters A and B provide the orientation in the main panels.
Current usage metrics show cumulative count of Article Views (full-text article views including HTML views, PDF and ePub downloads, according to the available data) and Abstracts Views on Vision4Press platform.
Data correspond to usage on the plateform after 2015. The current usage metrics is available 48-96 hours after online publication and is updated daily on week days.
Initial download of the metrics may take a while.