Fig. 4.
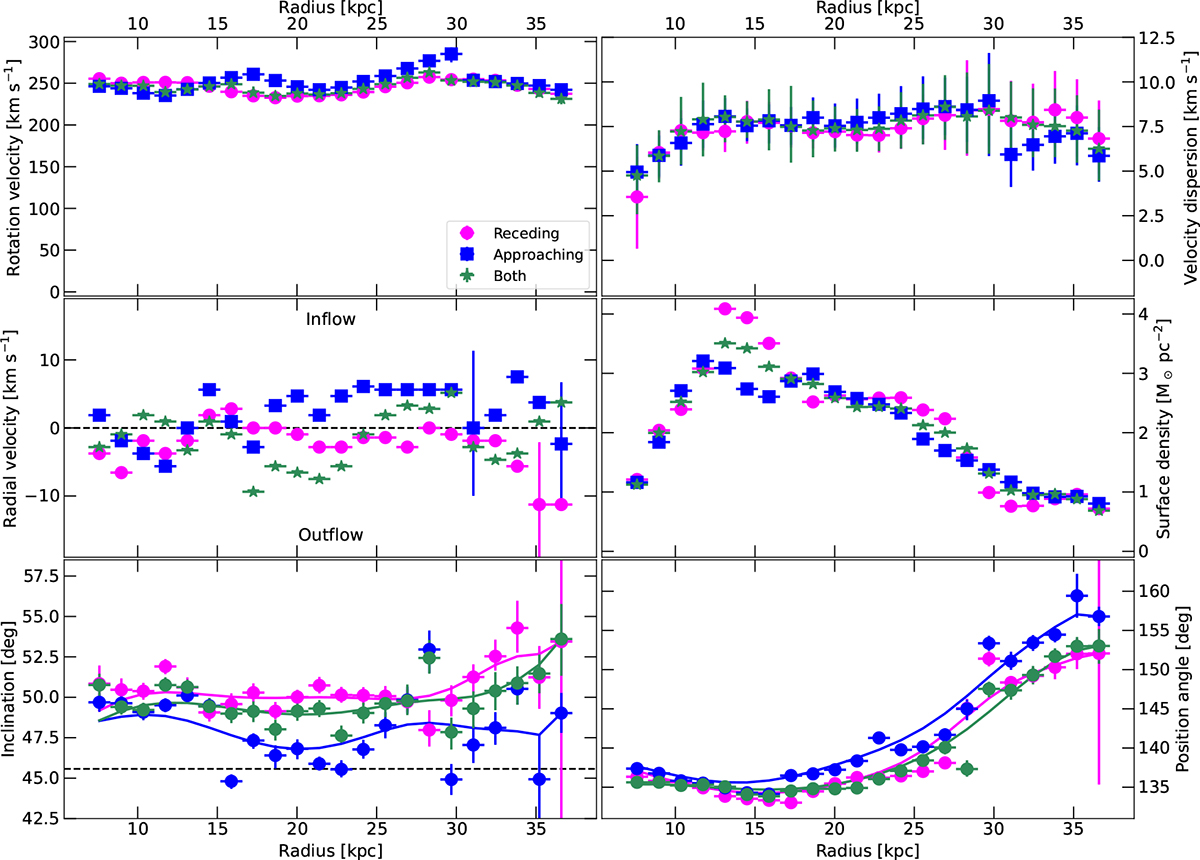
Download original image
Comparison of the best-fit parameters for the 3D model derived by 3D-Barolo fitting the approaching and receding side of the galaxy separately and simultaneously. From left to right and from top to bottom each panel shows vrot, σ0, vrad, ΣH I, i, and PA. The pink points refer to the best fit on the receding side, blue to the approaching side, and green to the simultaneous fit. The black horizontal dashed line in the vrad panel is a visual guide indicating the 0-level, whereas in the i panel is the indicative optical inclination angle from NED (de Blok et al. 2024).
Current usage metrics show cumulative count of Article Views (full-text article views including HTML views, PDF and ePub downloads, according to the available data) and Abstracts Views on Vision4Press platform.
Data correspond to usage on the plateform after 2015. The current usage metrics is available 48-96 hours after online publication and is updated daily on week days.
Initial download of the metrics may take a while.