Open Access
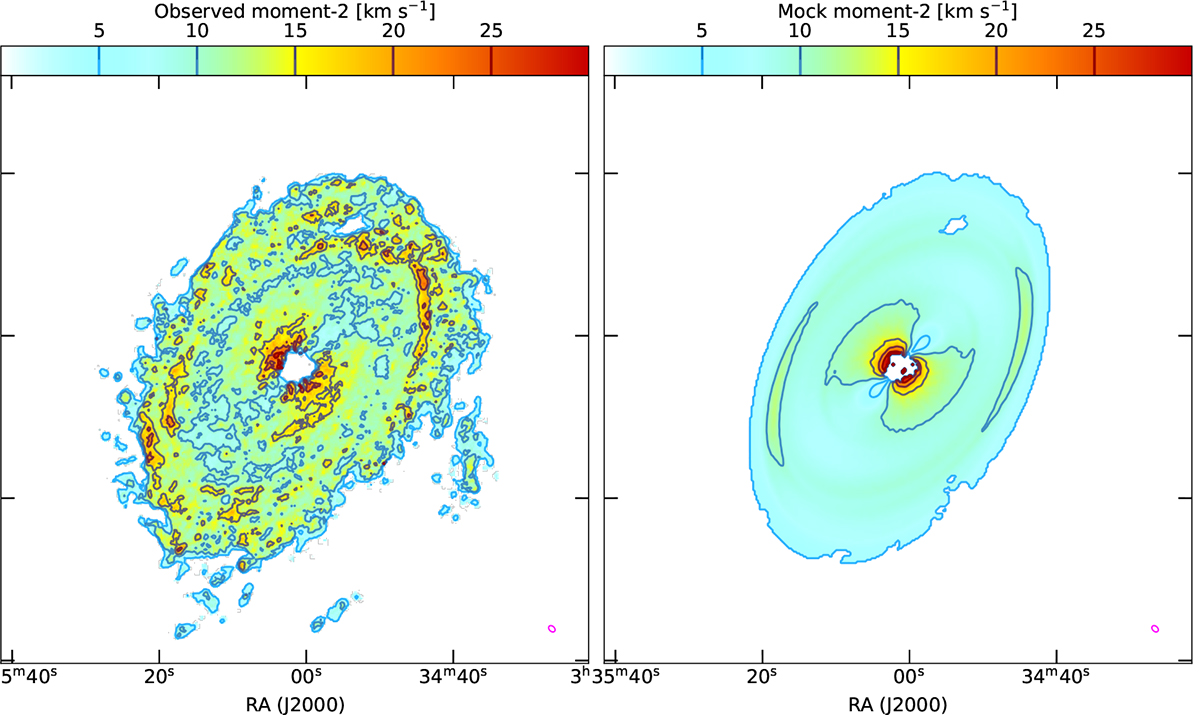
Fig. 5.
Download original image
Comparison between the observed (left) and mock (right) moment-2 map derived with 3D-Barolo. In the bottom right corner the 13.7″ × 9.6″ beam is displayed.
Current usage metrics show cumulative count of Article Views (full-text article views including HTML views, PDF and ePub downloads, according to the available data) and Abstracts Views on Vision4Press platform.
Data correspond to usage on the plateform after 2015. The current usage metrics is available 48-96 hours after online publication and is updated daily on week days.
Initial download of the metrics may take a while.