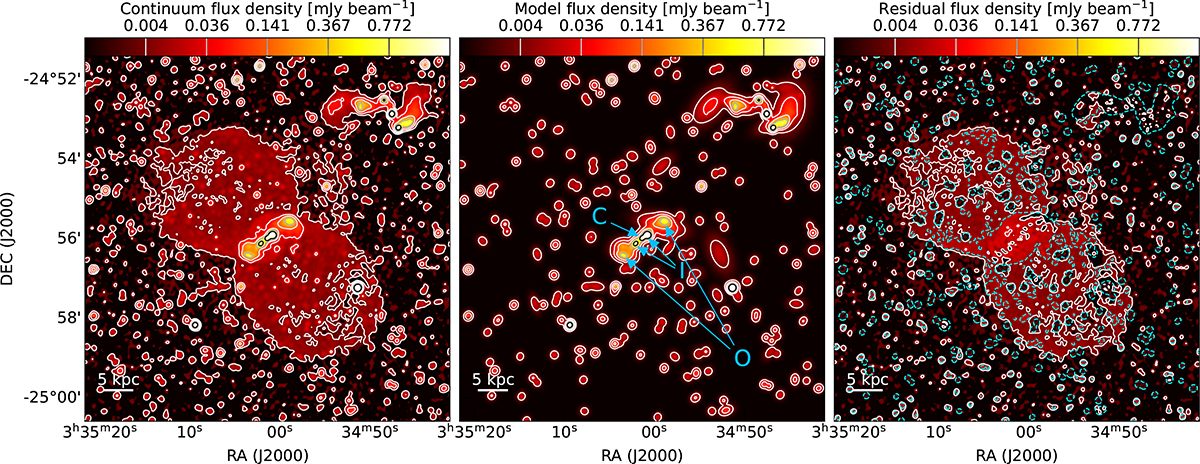
Fig. 6.
Download original image
1.4 GHz continuum maps. From left to right: Observed radio continuum, best-fit model from pPyBDSF, and the residuals in terms of data-model. The contour levels, with the lowest corresponding to 3σ, are given by the colour bar at the top. A 5 kpc reference line is given in the bottom left corner. In the central panel we indicate with blue arrows the locations of the core (C), the two inner hotspots (I), and the two outer hotspots (O). In the right panel we highlight the edge-brightening of the bubbles with the cyan dashed contours, corresponding to a flux density of 10 μJy beam−1.
Current usage metrics show cumulative count of Article Views (full-text article views including HTML views, PDF and ePub downloads, according to the available data) and Abstracts Views on Vision4Press platform.
Data correspond to usage on the plateform after 2015. The current usage metrics is available 48-96 hours after online publication and is updated daily on week days.
Initial download of the metrics may take a while.