Fig. 7.
Download original image
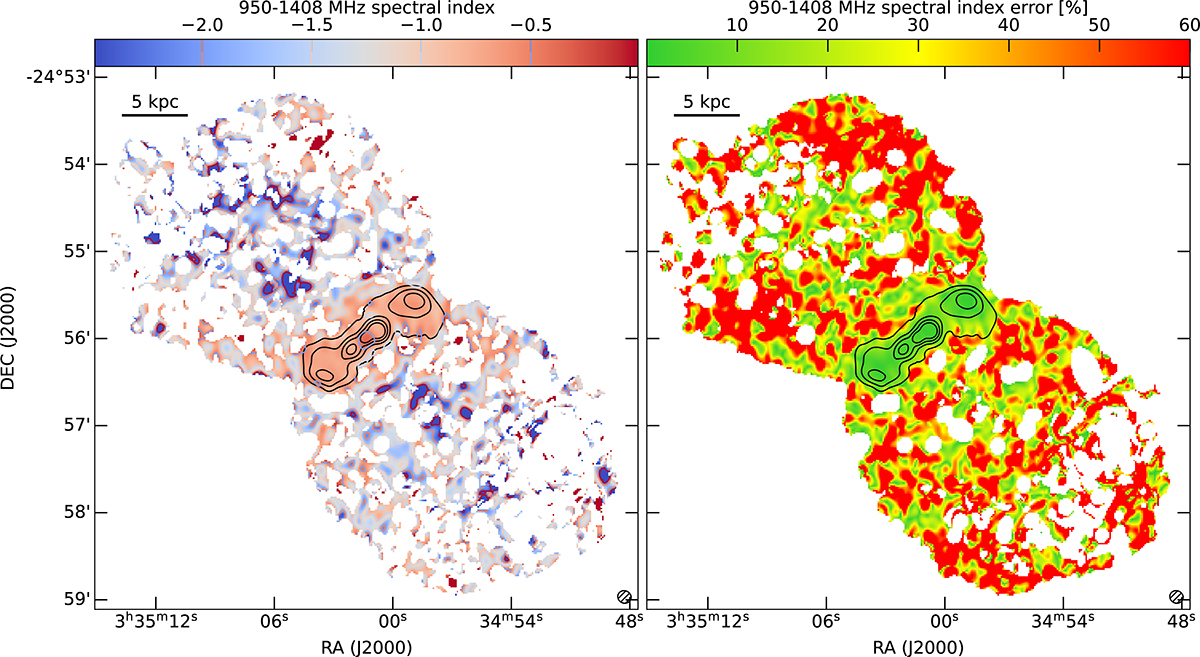
Spatially resolved 950–1408 MHz spectral index map (left panel) and percentage uncertainty (right panel). The white regions in the left panel are due to the masking of contaminant sources and unreliable fits (see text for the details). The contour levels are given in the colour bar. In the right panel we show the percentage error on the spectral index in terms of ![]() , where Δα is the uncertainty on α as derived by the least-squares fit. The LoS where Δα > 50% are marked in red. These were removed from the map on the left. Contaminant sources are masked. In both maps, the black contours refers to the radio continuum from the jet (levels: 36, 141, 367, 772 μJy beam−1), while the 7.4″ × 6.7″ beam is reported in the bottom right corner and a 5 kpc reference line is given in the top left corner.
, where Δα is the uncertainty on α as derived by the least-squares fit. The LoS where Δα > 50% are marked in red. These were removed from the map on the left. Contaminant sources are masked. In both maps, the black contours refers to the radio continuum from the jet (levels: 36, 141, 367, 772 μJy beam−1), while the 7.4″ × 6.7″ beam is reported in the bottom right corner and a 5 kpc reference line is given in the top left corner.
Current usage metrics show cumulative count of Article Views (full-text article views including HTML views, PDF and ePub downloads, according to the available data) and Abstracts Views on Vision4Press platform.
Data correspond to usage on the plateform after 2015. The current usage metrics is available 48-96 hours after online publication and is updated daily on week days.
Initial download of the metrics may take a while.