Open Access
Fig. 9.
Download original image
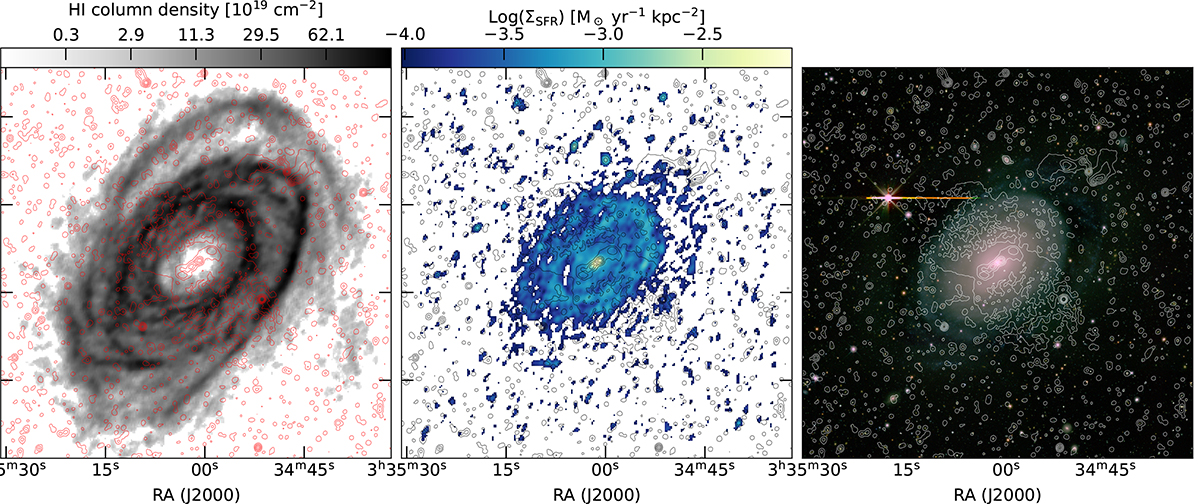
Overlays of the H I (left), star formation density (center), and optical (right) map with the radio continuum contours. Contour levels are (0.006, 0.06, 0.2, 0.6, 1.3) mJy beam−1, with the lowest being equivalent to 5σ. The optical image is an RGB composition of the gzri DECaLS observations.
Current usage metrics show cumulative count of Article Views (full-text article views including HTML views, PDF and ePub downloads, according to the available data) and Abstracts Views on Vision4Press platform.
Data correspond to usage on the plateform after 2015. The current usage metrics is available 48-96 hours after online publication and is updated daily on week days.
Initial download of the metrics may take a while.