Fig. 6.
Download original image
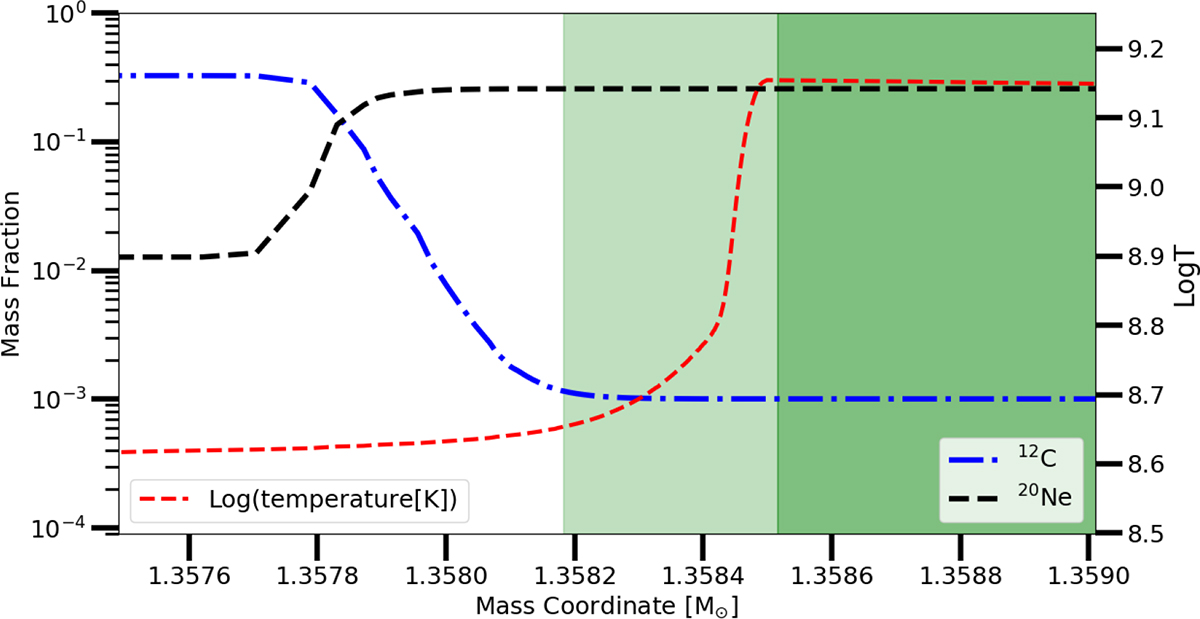
Temperature, 20Ne, and 12C mass fraction profiles as functions of the Lagrangian mass coordinate shown in the vicinity of the base of the C-flame convective zone in Model C. The dark and light green shaded areas represent stellar regions dominated by convection and convective boundary mixing, respectively. Across the latter, convective velocities decrease by a factor of 1000.
Current usage metrics show cumulative count of Article Views (full-text article views including HTML views, PDF and ePub downloads, according to the available data) and Abstracts Views on Vision4Press platform.
Data correspond to usage on the plateform after 2015. The current usage metrics is available 48-96 hours after online publication and is updated daily on week days.
Initial download of the metrics may take a while.