| Issue |
A&A
Volume 703, November 2025
|
|
|---|---|---|
| Article Number | A44 | |
| Number of page(s) | 14 | |
| Section | Stellar structure and evolution | |
| DOI | https://doi.org/10.1051/0004-6361/202555745 | |
| Published online | 05 November 2025 | |
Trans-Fe elements from type Ia supernovae
I. Heavy element nucleosynthesis during the formation of near-Chandrasekhar white dwarfs
1
Department of Physics, University of Naples Federico II, Via Cintia, Napoli, 80126 NA, Italy
2
INAF – Osservatorio Astronomico d’Abruzzo, Via M. Maggini, 64100 Teramo, Italy
3
The NuGrid Collaboration, http://www.nugridstars.org
4
E. A. Milne Centre for Astrophysics, University of Hull, Cottingham Road, Kingston upon Hull HU6 7RX, UK
5
School of Mathematical and Physical Sciences, Hicks Building, Hounsfield Road, Sheffield S3 7RH, UK
6
Heidelberg Institute for Theoretical Studies, Schloss-Wolfsbrunnenweg 35, 69118 Heidelberg, Germany
7
Zentrum für Astronomie der Universität Heidelberg, Institut für Theoretische Astrophysik, Philosophenweg 12, 69120 Heidelberg, Germany
8
Zentrum für Astronomie der Universität Heidelberg, Astronomisches Recheninstitut, Mönchhofstr. 12–14, 69120 Heidelberg, Germany
9
Department of Physics & Astronomy, University of Victoria, Victoria, BC V8W 2Y2, Canada
10
Joint Institute for Nuclear Astrophysics – Center for the Evolution of the Elements (JINA-CEE), Michigan State University, 640 South Shaw Lane, East Lansing, MI 48824, USA
11
INFN – Sezione di Napoli, Via Cintia, 80126 Naples, Italy
12
School of Chemical and Physical Sciences, Keele University, Lennard-Jones Laboratories, Keele ST5 5BG, UK
13
INFN – Sezione di Roma, Piazzale Aldo Moro 2, 00185 Rome, Italy
14
School of Mathematics and Physics, Queen’s University Belfast, Belfast BT7 1NN, UK
15
INAF – Osservatorio Astrofisico di Torino, Via Osservatorio, 20, 10025 Pino Torinese, TO, Italy
⋆ Corresponding author: This email address is being protected from spambots. You need JavaScript enabled to view it.
, This email address is being protected from spambots. You need JavaScript enabled to view it.
Received:
30
May
2025
Accepted:
24
July
2025
Abstract
Context. A type Ia supernova (SNIa) marks the catastrophic explosion of a white dwarf in a binary system. These events play a crucial role in galactic chemical evolution and serve as pivotal standardisable candles for measuring cosmic distances, underpinning the discovery of the Universe’s accelerated expansion. However, the progenitors of SNIa remain uncertain, introducing challenges to their use in cosmology and nucleosynthesis predictions.
Aims. In this work, we present a grid of five models detailing the evolution and nucleosynthesis of slowly merging carbon-oxygen white dwarfs approaching the Chandrasekhar mass.
Methods. These models test a variety of physics input settings, including accretion rates, nuclear reaction rates, convection parameters, and the composition of the accreted material. During the merger process, as the mass of the primary white dwarf approaches the Chandrasekhar limit, carbon burning is initiated first on the surface before eventually igniting explosively at the centre. As a consequence, the 22Ne(α,n)25Mg reaction activates in the outer layers of all models.
Results. The neutrons released in this way produce a weak s-process-like abundance distribution peaking at Kr, which is overproduced by more than a factor of ∼1000 compared to solar. The trans-Fe elements-enriched outer layer mass varies from ∼0.04 M⊙ to ∼0.11 M⊙, depending on the accretion rate. Our explosion simulation of these progenitor models ejects a significant amount of first-peak elements (e.g. Kr, Sr) as well as some long-lived radioactive species, such as 60Fe.
Conclusions. In a previous theoretical study, we found that a similar nucleosynthesis process during the progenitor phase may also occur on the surface of near-Chandrasekhar white dwarfs formed through the accretion of H-rich material via the single-degenerate scenario. Therefore, these results suggest that trans-Fe enrichment might be a hallmark of near-Chandrasekhar SNIa ejecta, regardless of the specific progenitor channel, and could provide a new spectral signature that distinguishes them from sub-Chandrasekhar explosions.
Key words: stars: abundances / binaries: general / stars: evolution / supernovae: general / white dwarfs / Galaxy: evolution
© The Authors 2025
 Open Access article, published by EDP Sciences, under the terms of the Creative Commons Attribution License (https://creativecommons.org/licenses/by/4.0), which permits unrestricted use, distribution, and reproduction in any medium, provided the original work is properly cited.
This article is published in open access under the Subscribe to Open model. This email address is being protected from spambots. You need JavaScript enabled to view it. to support open access publication.
1. Introduction
About half of low- and intermediate-mass stars (M < 8 M⊙) in the Solar neighbourhood host at least one companion (Moe & Di Stefano 2017). At the end of their evolution, these stars lose their entire envelope (Iben & Renzini 1983; Herwig 2005), leaving behind their bare, compact carbon-oxygen (CO) core, where no nuclear reactions occur. The resulting structure is supported solely by electron degeneracy pressure and is known as a white dwarf (WD). If a WD is in a binary system, it can accrete matter from a companion, potentially triggering a type Ia supernova (SNIa) explosion. Two main types of explosions are possible: near-Chandrasekhar and sub-Chandrasekhar. Both scenarios can arise from two primary evolutionary channels: the single-degenerate channel (Whelan & Iben 1973; Nomoto et al. 2007) and the double-degenerate channel (Iben 1984; Pakmor et al. 2011). Near-Chandrasekhar SNIa from the single-degenerate channel originate from a WD that accretes mass from the H-rich envelope of a less evolved stellar companion. In contrast, near-Chandrasekhar SNIa from the double-degenerate channel involve a companion that is another WD, with a mass ratio of the components less than ∼0.8 (Pakmor et al. 2011). In this case, the separation between the two WDs decreases as a consequence of gravitational wave emission until they merge; the less massive (i.e. secondary) WD is tidally disrupted, forming a CO-rich accretion disc around the primary WD. In both cases, a slow accretion process ensues and the primary WD gradually approaches the critical Chandrasekhar mass (the maximum mass supported by electron degeneracy, around 1.39 M⊙ for a CO WD). Carbon burning then ignites explosively, causing an SNIa. In the case of sub-Chandrasekhar SNIa from the single-degenerate channel, the accreted material is mainly helium, which can trigger a detonation before the Chandrasekhar mass is reached (see e.g. Livne 1990; Woosley & Weaver 1994; Piersanti et al. 2014). Finally, sub-Chandrasekhar SNIa from the double-degenerate channel result from the violent merger of two WDs of similar mass (Pakmor et al. 2012), or from cases in which a He shell thick enough (at least ∼0.01 M⊙) is present on top of both WDs (Pakmor et al. 2013, 2022; Shen et al. 2024).
In the standard Big Bang nucleosynthesis picture, apart from H, He, and Li, every chemical element in the Universe was first forged by sequences of nuclear reactions (called nucleosynthesis processes) in stars and related explosions (Burbidge et al. 1957; Cameron 1957). In this way, the composition of our Milky Way, as well as that of all other galaxies, progressively changed from a primordial one (consisting of only H, He, and Li) to one increasingly enriched in heavier elements. This process is known as galactic chemical evolution (GCE). Type Ia supernovae are the major producers of Fe-peak elements and are also highly relevant for the α-element content in the Galaxy (Matteucci & Greggio 1986; Kobayashi et al. 2020). Additionally, the potential relevance of SNIa in the origin of other elements depends on the fraction of SNIa produced via each of the aforementioned channels. For example, Travaglio et al. (2015) (hereafter TRV15) showed that near-Chandrasekhar single-degenerate SNIa can be a significant source of a class of trans-Fe, proton-rich isotopes known as p-nuclei (produced by the so-called p-process Arnould & Goriely 2003). The main assumption of TRV15, later confirmed by Battino et al. (2020), is the crucial presence of a trans-Fe neutron-capture element distribution up to Pb (referred to as the ‘seed distribution’) formed on the WD surface during the accretion of H-rich material from the companion. Photon-induced reactions on this seed distribution during the explosion can then result in the formation of p-nuclei.
Quantifying the fraction of each SNIa progenitor scenario is therefore a matter of urgency, both for the role of SNIa in GCE and in cosmology. In particular, the relative contributions of near-Chandrasekhar and sub-Chandrasekhar explosions are still not fully understood. Based on spectra from a large sample of early-type galaxies, Johansson et al. (2016) find that near-Chandrasekhar single-degenerate SNIa should account for less than 6% of the total SNIa population. This is consistent with WD models accreting H-rich material at solar metallicity from both Denissenkov et al. (2017) and Battino et al. (2020). Denissenkov et al. (2017) show that the low mass-retention efficiency following He flashes, naturally arising during accretion, would severely limit the single-degenerate path to near-Chandrasekhar masses. Battino et al. (2020) estimates the absolute minimum initial mass a WD must have in order to reach the Chandrasekhar limit via accretion of H-rich material at around solar metallicity to be ∼0.91 M⊙. Considering that O’Brien et al. (2024) find ∼3% of WDs in their 40 pc sample with masses > 1 M⊙, and about the same fraction have masses between ∼0.9 M⊙ and ∼1 M⊙, this corresponds to ∼6% of the local WD population. On the other hand, Lach et al. (2020) computed the nucleosynthetic ejecta of sub-Chandrasekhar single-degenerate SNIa and re-determined the contributions of both near- and sub-Chandrasekhar events to the total SNIa rate by simultaneously reproducing the observed [Ti/Fe], [Mn/Fe], and [V/Fe] in the Galaxy. They report that at least 45% of all SNIa should originate from near-Chandrasekhar mass explosions, as a too large number of sub-Chandrasekhar SNIa from He detonations would lead to tensions in [Ti/Fe] and [V/Fe] since these elements are produced in super-solar amounts in them. This result was recently qualitatively confirmed by further studies. Shen et al. (2024) show that most WDs would be born with enough He for ignition to be plausible, implying that the majority of SNIa could originate from sub-Chandrasekhar explosions. However, aside from the uncertainties introduced by their 2D treatment of inherently 3D processes leading to detonation, the Fe masses produced in the models of Shen et al. (2024) (once 56Ni has fully decayed) remain relatively low, even accounting for the early compression of the secondary WD by the primary detonation (at most ∼0.15 M⊙ in the case of a primary WD mass < 1 M⊙, representative of the majority of CO WDs, see also Boos et al. 2024). This may confirm that He shell detonation sub-Chandrasekhar SNIa, while still very plausibly responsible for the majority of SNIa, cannot fully replace near-Chandrasekhar SNIa without resulting in super-solar [Ti/Fe] and [V/Fe] values. Moreover, Trueman et al. (2025) attempted to calculate the sub-Chandrasekhar SNIa fractions (fsub) needed to fit the evolution of one Fe-peak element at a time versus [Fe/H]. While their fsub varied substantially depending on which tracer element was considered, a minimum near-Chandrasekhar fraction of around 40% appears to be a reasonable average of their results. However, this conclusion depends on the massive-star ejecta yields adopted in the calculations (see also Gronow et al. 2021). Therefore, if the contribution of near-Chandrasekhar single-degenerate SNIa to the total rate is observationally constrained to be below ∼6%, then the possibility that ∼34% of near-Chandrasekhar SNIa originate from the double-degenerate channel must be considered. In principle, this may occur not only through the direct accretion of CO-rich material from a CO WD, but also via He from a He star (Piersanti et al. 2014). However, this channel may be severely limited by the simultaneous requirement of both a population of significantly massive He stars (M ≥ 0.8 M⊙) with massive companions (MWD ≥ 1.0 M⊙) and a very specific accretion rate (between 1 × 10⁻⁶ M⊙ yr−1 and 2 × 10⁻⁶ M⊙ yr−1). Higher accretion rates would lead to the formation of an ONeMg WD, and thus not produce an SNIa, while lower rates would trigger strong He flashes once the primary WD exceeds ∼1.2 M⊙, making further accretion difficult due to the resulting high mass loss. The limitations of direct He accretion up to the Chandrasekhar mass are therefore somewhat similar to those affecting H accretion via the single-degenerate scenario, and may likewise contribute to only a small fraction of SNIa. This leaves a residual ∼30% that must originate from an alternative source, such as slow CO WD mergers. This remains an open question, with three main shortcomings identified. First, during disc formation, C could ignite near the accreting star’s surface and propagate rapidly inward, forming an ONeMg WD instead of causing a thermonuclear explosion. This was ruled out by Lorén-Aguilar et al. (2009), who found that although C burning does occur, it is quickly extinguished. Second, mass transfer from the disc to the primary WD could proceed at a high rate (∼10−5 M⊙ yr−1), potentially causing an off-centre ignition of C burning before the WD reaches the Chandrasekhar mass. Such burning would then propagate towards the centre, again possibly turning the whole structure into an ONeMg WD Siess (2006). However, Denissenkov et al. (2013) showed that even a small amount of convective boundary mixing (CBM) removes the physical conditions required for the C-flame to propagate all the way to the centre. Furthermore, Piersanti et al. (2003a) argued that rotation, naturally arising in merging WDs, can self-regulate the accretion rate to as low as a few 10−7 M⊙ yr−1. This last result was, however, contested by both Saio & Nomoto (2004) and Yoon & Langer (2005), who raised questions about the validity of the assumption of rigid rotation as well as of the high estimated ratio of rotational to gravitational energy. The third and final shortcoming is that the number of observationally confirmed double-degenerate systems near the Chandrasekhar mass limit is very small (fewer than five systems; see Breedt et al. 2017). However, population synthesis estimates suggest the average WD merger timescale in the Galaxy is ∼0.7−1 Gyr (Toonen et al. 2012). Using the observed Milky Way SNIa rate, roughly 4.6 × 10⁶ SNIa would occur over this time. With ∼109 WDs in the Galaxy (Harris et al. 2006), we would expect about one in ∼200 observed WDs to be an SNIa progenitor if SNIa arise solely from double-degenerate binaries. Allowing for a factor of ∼2 systematic uncertainty in the observed SNIa rate (Li et al. 2011) and imperfect detection efficiency in follow-up observations, the true number could easily be half this estimate or less (Breedt et al. 2017). Therefore, we should expect to find around two double-degenerate systems near the Chandrasekhar mass in every ∼1000 observed WDs. Interestingly, this is exactly what the SN Ia Progenitor surveY (SPY) found: among 1014 catalogued WDs, it discovered 39 double-degenerate binaries, two of which had a total mass close to the Chandrasekhar limit. Furthermore, Cheng et al. (2020) searched for evidence of double-WD merger products by analysing high-mass WDs in Gaia DR2. They obtained a precise double-WD merger rate consistent with binary population synthesis results and in agreement with SPY, supporting the idea that double-WD mergers may contribute significantly to the SNIa population.
In this work, we assume that Chandrasekhar-mass WDs can indeed form via the double-degenerate channel through a slow merger process mediated by an accretion disc. We compute the stellar evolution and nucleosynthesis during the progenitor phase (i.e. the evolutionary phase of the system prior to its explosion as a supernova, beginning with the onset of mass accretion and ending with the ignition of explosive carbon burning at the centre) and investigate whether a trans-Fe element distribution can form in a manner similar to that observed in near-Chandrasekhar single-degenerate SNIa progenitors, as previously verified by Battino et al. (2020). The only study to have considered this hypothesis was presented by Battino et al. (2022), albeit in a very preliminary form. Their study focuses on a single composition for both the primary and secondary WDs, a single accretion rate, and only on the progenitor phase, no explosion is simulated. In this paper, we therefore aim to expand on the initial study by Battino et al. (2022) by exploring a range of accretion rates and CO-rich compositions accreted onto the primary WD. Additionally, we compute the nucleosynthesis resulting from the explosion of our progenitor models to assess whether significant amounts of trans-Fe elements are ejected. If so, the potential spectral identification of trans-Fe elements in ‘normal’ SNIa emission could serve as a new signature of the explosion of a near-Chandrasekhar mass WD. No sub-Chandrasekhar explosive model in the literature is known to eject substantial amounts of first-peak elements (such as Kr, Rb, Sr, Y, and Zr) or heavier species. Woosley & Kasen (2011) reported overproduction factors for some Kr isotopes, but values exceeding 100 occur only for the p-only nucleus 78Kr, implying that the overall elemental overproduction compared to solar, and the total ejected Kr mass, remain relatively low, of the order of a few 10−8 M⊙. Keegans et al. (2023) compute complete abundance yields using a full nuclear reaction network up to Bi for 39 models of SNIa explosions, based on three progenitors: a 1.4 M⊙ deflagration-detonation model, a 1.0 M⊙ double-detonation model, and a 0.8 M⊙ double-detonation model. These yields are calculated for 13 metallicities, with 22Ne (i.e. the main neutron source during the explosion and critical for trans-Fe element nucleosynthesis) mass fractions ranging from zero to the very high super-solar value of 0.1. Even in the models with the highest 22Ne abundances, the heaviest trans-Fe species showing any positive overproduction factor relative to solar is 70Ge, while no first-peak elements are produced. This is linked to the very short timescales between the onset of mass transfer and the final explosion in violent CO WD mergers (less than ∼10 minutes, Pakmor et al. 2012), and between the start of surface nuclear burning and the trigger of the He detonation in double-detonation models (∼5 minutes, see Pakmor et al. 2013).
In the following pages, the input physics, relevant setups, and codes adopted are described in Section 2. The calculation of full stellar and nucleosynthesis models during the progenitor phase are discussed in Sections 3 and 4 respectively, while our explosive nucleosynthesis calculations are presented in Section 5. Our conclusions are presented in Section 6.
2. Input physics and computational methods
We used the 1D stellar code Modules for Experiments in Stellar Astrophysics (MESA, revision 10108) to compute the SNIa progenitor models presented in this work. We cooled the CO WD model 0.927-from-6.0-z2m2.mod, included in the MESA data folder and with a mass of 0.927 M⊙, until its effective temperature dropped below 3.5 × 10⁵ K and then used it as the starting model for all progenitor calculations. The choice of this particular mass and cooling criterion was made to facilitate comparison with the results of Wu et al. (2019), shown in their Figure 2.
We employed three different sets of chemical compositions for the material accreted from the secondary WD, as shown in Table 1. The first set (Abu Set1) was obtained by simulating the evolution of a 1.65 M⊙, Z = 0.011 star from the pre-main sequence to the formation of the CO WD, using the same physics inputs as in Ritter et al. (2018). At the end of the evolution, the H-free core (defined as the mass enclosed within the region where the hydrogen mass fraction drops below 10−4) was fully mixed, and the resulting abundances were adopted as the accreted composition. The second and third sets (Abu Set2 and Abu Set3) were used to explore the impact of changing the accreted abundances of three key species. Abu Set2 is identical to Abu Set1 but has an enhanced abundance of the key neutron source 22Ne, which is qualitatively equivalent to accreting higher-metallicity material. Abu Set3 builds on Abu Set2 but has equal mass fractions of C and O, both set to 0.481. A very important aspect is the presence of He in the accreted composition. Pakmor et al. (2013) simulated the merger of two CO WDs, each with a thin He shell (0.01 M⊙) on top, and showed that the accretion of He onto the primary WD leads to a detonation in the He shell. This detonation can propagate inward and ignite explosive C-burning, resulting in a sub-Chandrasekhar SNIa explosion. However, in this work we assume that accretion occurs through an accretion disc that is both fully mixed and formed over a short timescale (typically ∼1.5 minutes after the matter flowing out of the secondary hits the surface of the primary WD for systems with a mass ratio ∼0.75, see Lorén-Aguilar et al. 2009). We therefore focus on the case where the explosion does not occur immediately during the early dynamical phase of the merger, but rather proceeds via disruption of the secondary and subsequent accretion from a disc. Furthermore, the typical mass of the He intershell in a 6 M⊙ star at approximately solar metallicity (i.e. the progenitor of the ∼0.9 M⊙ WD considered here) is ∼0.004 M⊙, with a typical He mass fraction of ∼0.5 (Ritter et al. 2018), resulting in ∼0.002 M⊙ of He. This is roughly a factor of five lower than the 0.01 M⊙ He shell considered in Pakmor et al. (2013). However, more work is needed to systematically explore the likelihood of igniting a He-detonation with lower He shell masses than those considered by Pakmor et al. (2013). This is an important topic, particularly since Shen et al. (2024) recently showed that, assuming He can be ignited under these conditions, the propagation of a double detonation remains plausible even for such small He shell masses of ∼0.002 M⊙.
Chemical composition mass fractions of the accreted material from the secondary WD used in this work.
We used two different nuclear reaction networks during two distinct phases of the merging process. At the beginning of the mass increase, we employed the co-burn-extras.net MESA network, which primarily includes the isotopes required for C-burning up to 28Si, connected through more than 50 reactions. We extended the isotope list of co-burn-extras.net by adding the Fe-peak isotopes listed in Table 1, which act as seeds for neutron captures once the primary WD approaches the Chandrasekhar mass and C-burning ignites at the surface. Until this point, reactions beyond 28Si are negligible and were therefore excluded. When the temperature at the base of the accreted material exceeds 1 GK, C-burning is triggered, and the 22Ne(α,n)25Mg neutron source becomes active in the outer layers of the primary WD. In this final stage, we extended the nuclear reaction network up to 157Eu, including a total of 429 isotopes from H to Eu. All isotopes in the network were connected through the relevant nuclear reactions in order to accurately follow the neutron-capture nucleosynthesis during surface C-burning.
Charged-particle-induced thermonuclear reaction rates involving nuclei in the range 1 ≤ Z ≤ 14 from the Nuclear Astrophysics Compilation of REactions compilation (NACRE, Angulo et al. 1999) were adopted if available. For all other reactions, up to 157Eu, we adopted the rates recommended in the JINA REACLIB library ReaclibV2.2 (see Cyburt et al. 2010), except for the 12C+12C reaction rate from Gasques et al. (2005), the 12C(α,γ)16O from Kunz et al. (2002), and the 22Ne(α,n)25Mg and 22Ne(α,γ)26Mg from Adsley et al. (2021). Weak reactions rates are primarily based on the tabulations of Langanke & Martínez-Pinedo (2000), complemented by Fuller et al. (1985) and Oda et al. (1994).
We modelled convective mixing using the standard mixing length theory (MLT, Böhm-Vitense 1958), wherein the free mixing-length parameter αMLT defines the mean free path (i.e. the mixing length) of a convective element in units of the pressure scale height. We also included CBM, following the exponential overshooting formalism of Herwig (2000):
 (1)
(1)
where dr is the geometric distance to the convective boundary. The term f1 × Hp0 denotes the scale height of the overshooting regime. The values D0 and Hp0 are the diffusion coefficient and the pressure scale height at the convective boundary, respectively. The parameter f1 was set to 0.004 under H-shells (as in Denissenkov et al. 2014) and to 0.01 under He shells (Herwig et al. 2007) and heavier shells.
We used CO-enhanced (Type 2) opacities throughout the calculations, based on OPAL tables (Iglesias & Rogers 1996). To stabilise the initial phase, just before the onset of a net mass increase dominated by thermal instabilities, we reduced the opacity to suppress the iron opacity bump by applying an opacity reduction factor of 0.01 in the temperature range 5.3 < log T < 5.7. We adopted electron conduction opacities from Cassisi et al. (2007). In case density or temperature conditions fell outside the region covered by Cassisi et al. (2007), we used the Iben (1975) fit to the Hubbard & Lampe (1969) electron conduction opacity for non-degenerate conditions and the Yakovlev & Urpin (1980) fits for degenerate conditions.
Table 2 shows the main settings adopted in the grid of SNIa progenitor models presented in this work. To explore the impact of different physical inputs on nucleosynthesis, we characterised each model by a specific combination of accreted abundances, mass accretion rate, and the value of the αMLT parameter. In particular, we focused on accretion rates > 2 × 10⁻⁶ M⊙ yr−1, as these are the conditions necessary for surface C-burning ignition (Piersanti et al. 2003b) and thus the production of trans-Fe elements, the main focus of the present work.
Main settings adopted in the grid of SNIa progenitor models presented in this work.
We used the NuGrid code tppnp (tracer particle post-processing network-parallel) to compute nucleosynthesis resulting from the explosion of our progenitors. A full description of the tppnp code can be found in Jones et al. (2019), with additional details about the nuclear reaction network provided in Ritter et al. (2018) and Pignatari et al. (2016). We provide additional details about the tppnp code in Section 5.
3. Progenitor structure models
3.1. General features
Figure 1 shows the Hertzsprung–Russell (HR) diagrams of the models introduced in Table 2. Models A, B, and C follow very similar tracks, while models D and E show significant differences. Due to the increased 12C abundance in the accreted material, surface C-burning in Model E ignites at a lower temperature than in models A, B, and C. This shifts the evolutionary track towards lower temperatures as C-burning ignites and increases the luminosity by more than an order of magnitude. Similarly, the higher accretion rate in Model D causes the temperature at the base of the accreted material to rise more rapidly, reaching surface C-burning conditions earlier. As a result, the primary WD has a lower mass at the time of ignition, and the degree of electron degeneracy in the WD’s plasma is consequently also reduced. Therefore, surface C-ignition occurs at a lower temperature than in all other models with lower accretion rates. This affects the HR track (bottom panel of Figure 1), which is visibly shifted towards lower temperatures than in the other models. Furthermore, in Model D, C-ignition proceeds as a series of flashes occurring at progressively higher temperatures as mass accretion continues.
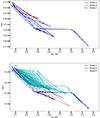 |
Fig. 1. Hertzsprung–Russell diagrams of the models listed in Table 1. The evolution starts at the bottom-right end of the tracks. |
Figure 2 also shows the C-flashes in the Kippenhahn diagrams of models D and C. In both models, the initial mass accretion proceeds steadily until the ignition of surface C-burning at a higher WD mass. This mass depends on the accretion rate and occurs before C-burning initiates the simmering phase prior to the final explosion. Specifically, in Model D, surface C-burning ignites at MWD ≃ 1.275 M⊙. This is followed by 18 C-flashes, each driving the formation of a small convective region at the WD surface. In contrast, the lower accretion rate in Model C causes surface C-ignition to occur at a higher WD mass, MWD ≃ 1.374 M⊙. As shown in Figure 3, this is primarily due to the higher temperature at the base of the accreted material, at a given WD mass, in models with higher mass accretion rates. The temperature and density profiles of models C and D are presented at different stages during the mass accretion phase, up to the ignition of surface C-burning. This ignition is marked by a sharp temperature peak exceeding 109 K at the base of the accreted material. These profiles closely resemble those obtained by Wu et al. (2019). During mass accretion, two main processes determine the temperature peak at the base of the accreted layer: (1) thermal diffusion into the WD interior, which tends to lower the temperature, and (2) compressional heating due to accreted mass, which tends to increase it (Piersanti et al. 2014). The higher mass deposition rate onto the primary WD in Model D results in a shorter compressional heating timescale at the accretor’s surface. Specifically, the disparity between compressional heating and inward thermal diffusion timescales increases. Consequently, the temperature at the base of the accreted layer increases more rapidly and reaches a higher value in Model D than in Model C for the same primary WD mass during accretion. Ultimately, C-burning ignites when the local temperature reaches approximately 109 K.
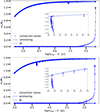 |
Fig. 2. Kippenhahn diagrams of models C (top panel) and D (bottom panel). |
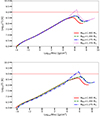 |
Fig. 3. Temperature and density profiles of models C (top panel) and D (bottom panel) at different moments during the mass accretion. |
3.2. C-flame propagation
Table 3 shows that each first surface C-flash lasts between 150 and 550 years, depending on the model. Notably, models B and C differ by approximately 65%, with the sole physical input difference being the value of the mixing-length parameter α. Figure 4 illustrates the first surface flash in both models B and C through two Kippenhahn diagrams plotted as a function of time. Although the convective zone extends to the same mass coordinate in both models (Mr = 1.33 M⊙), it reaches this point over visibly different timescales, indicating a different propagation speed of the burning front. In all stellar models discussed here, the first surface C-burning episode develops a C-flame front moving inward, inducing the formation of a convective shell that is dragged towards the stellar interior as the burning front advances. Figure 5 shows that the convective region induced by C-burning is tightly bound to the location of the temperature peak, marking the inward-moving burning front, and does not extend to the surface once flame propagation begins. This behaviour implies that each zone experiences convective C-burning for a duration inversely proportional to the C-flame propagation speed, impacting the final neutron exposure and the trans-Fe element distribution in that zone.
Mean neutron densities during surface C-burning, duration of the 1st C-flash, and total number of surface C-flashes for all models presented in this work.
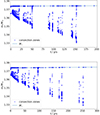 |
Fig. 4. Kippenhahn diagram of the first surface C-flash and related propagation of C-flames in models B (top panel) and C (bottom panel). The x axis shows the time from the onset of surface C-burning. |
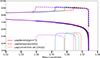 |
Fig. 5. Temperature, density, and convective velocity profiles of Model C at different times during the development of the first surface C-burning episode. Lines of the same colour correspond to the same simulation time step. The convective region induced by C-burning is tightly bound to the location of the temperature peak, which corresponds to the location of the inward-propagating burning front. |
In 1D stellar models, the impact of the mixing length parameter α on the C-flame propagation speed is linked to how the diffusion coefficient is defined within convectively unstable regions, i.e.  , where l is the mixing length and vc is the average velocity of the convective elements according to mixing length theory (MLT) (Böhm-Vitense 1958). The diffusion coefficient can be written as
 (2)
(2)
where Hp is the pressure scale height, κ is the opacity, c is the speed of light, ρ is the density, g is the gravitational acceleration, ∇rad and ∇ad the radiative and adiabatic temperature gradients, respectively, and β is the gas pressure fraction. This leads to Dc, as well as D0 in the CBM equation (2), being proportional to α2/3.
Figure 6 shows the temperature, 20Ne, and 12C mass fraction profiles near the bottom of the C-flame convective zone. As discussed earlier, the location of the bottom of the C-shell convective zone during the first C-flash remains closely aligned with the temperature maximum. However, CBM penetrates the convectively stable layers below the convective boundary, homogenising the 12C abundance by mixing it with the 12C-depleted material from the C-burning convective zone. This results in a low and nearly flat 12C abundance profile in the stable layers below the convective boundary. Consequently, the steep rise in 12C is shifted by ∼3 × 10⁻⁴ M⊙ away from the location of the peak temperature. As a result, a decrease in log T immediately below this point cannot be offset by a sufficiently strong increase in the 12C mass fraction. Under these conditions,C-flame propagation becomes significantly more difficult than in the absence of CBM, until the C abundance behind the C-flame is reduced to such a low level that prevents further ignition (see also Denissenkov et al. 2013). At that point, the flame will be quenched before reaching the WD centre.
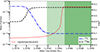 |
Fig. 6. Temperature, 20Ne, and 12C mass fraction profiles as functions of the Lagrangian mass coordinate shown in the vicinity of the base of the C-flame convective zone in Model C. The dark and light green shaded areas represent stellar regions dominated by convection and convective boundary mixing, respectively. Across the latter, convective velocities decrease by a factor of 1000. |
Timmes et al. (1994) emphasised that a physically consistent simulation of the C-flame requires very fine spatial resolution, with mass zones thinner than ∼1 km in the burning region. In our simulations of C-flame propagation, we include nearly 50 mass zones within 1 km around the temperature peak in the C-burning region, as illustrated in Figure 7.
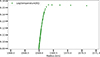 |
Fig. 7. Typical mass zoning in the region of the temperature peak within the C-flame front in our simulations. |
4. Trans-Fe nucleosynthesis
During C-burning, the stellar plasma in our models is highly enriched in α-particles. This is due to their release via the 12C(12C,α)20Ne reaction. These α-particles are then captured by 22Ne and converted into neutrons via the 22Ne(α,n)25Mg reaction.
The rate of neutron release establishes a high neutron density, ranging from ∼1013 to ∼1014 neutrons cm−3 during surface C-burning. Additionally, earlier surface C-burning ignition in Model D (in terms of WD mass) allows mass accretion to continue for a longer period after the first C-flash, before the star approaches the Chandrasekhar limit and ignites explosive C-burning in the centre. This explains why Model D experiences many more surface C-flashes than the other models (see Table 3).
Figure 8 shows the abundance profiles of selected species at the top of the primary WD at the onset of explosive C-burning. We define the onset of explosive central carbon ignition as the epoch when the nuclear burning timescale becomes comparable to the local convective timescale at the centre. In our models, this occurs at a central temperature of approximately 7.9 × 10⁸ K, in excellent agreement with Woosley et al. (2004), who, guided by multidimensional hydrodynamic simulations, identified the onset of the runaway at average central temperatures between 7.7 and 7.9 × 10⁸ K. This temperature marks the simmering phase and the development of a convective core prior to the final explosion. In all of our models, trans-Fe elements are synthesised on the WD surface, forming a distribution peaked at Kr. For example, 86Kr has a mass fraction ranging between 10−5 and 3 × 10⁻⁵, corresponding to an overproduction factor of approximately 500 to 1300 relative to solar. The surface layer enriched with heavy elements spans a mass thickness between ∼0.04 and ∼0.11 M⊙. The bottom boundary of this trans-Fe-rich external layer is located at a mass coordinate close to the primary WD mass at the moment of surface C-burning ignition, whereas the top boundary lies close to the surface, at a near-Chandrasekhar mass coordinate. Since Model D ignited surface C-burning earlier and at a lower WD mass than all other models, it features the thickest trans-Fe-enriched layer (∼0.11 M⊙). Integrating Kr isotope abundances over the entire trans-Fe layer yields a total Kr mass of ∼4 × 10⁻⁶ M⊙ produced in Model D.
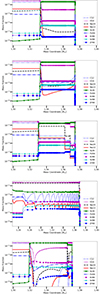 |
Fig. 8. Trans-Fe element abundance profile in the external layers of the near-Chandrasekhar primary WD for models listed in Table 2. Models from A to E are shown from top to bottom. |
Moreover, each of the 15 surface C-flashes in Model D affected the 12C and 22Ne abundance profiles, producing abundance dips wherever C-burning and 22Ne+α reactions were activated. A similar effect is also visible in other models, such as Model C, which experiences three surface C-flashes.
Figure 9 illustrates surface structure evolution and the development of five of the 15 C-flash episodes in Model D. Each C-flash episode drives the formation of a convective zone, typically between 5 × 10⁻³ M⊙ and 10−2 M⊙ in size, where trans-Fe elements are synthesised via neutron captures. Figure 10 presents the key species and temperature profiles at the onset of two of these five C-flashes. The temperature peaks at ∼1.3 GK at the base of each convective zone driven by C-flashes. This location coincides with the step in the abundance profiles of both 20Ne and 86Kr, indicating active C-burning and trans-Fe element production, respectively.
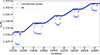 |
Fig. 9. Kippenhahn diagram of surface structure evolution and the development of five C-flashes episodes in Model D. The time coordinate on the x axis is expressed in computational time steps to ensure a proper graphical resolution of the C-flash-driven convective zones. |
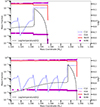 |
Fig. 10. Key species and temperature profiles at the onset of two of the five C-flashes in Model D shown in Figure 9. |
All models show a strong production of 28Si through α particle capture on the abundant 20Ne generated during C-burning. In all models except Model D, 28Si is overproduced by a factor of ∼1000 compared to solar, while in Model D it is overproduced by a factor of only ∼10. This difference arises from the lower surface C-burning temperature in Model D, caused by its lower primary WD mass at ignition.
Figure A.1 displays the final isotopic abundance distribution in the external trans-Fe-enriched layers of the models listed in Table 2. We extracted all abundances at the same mass coordinate, Mr = 1.35 M⊙, representative of trans-Fe element production in all models (see Figure 8). Nucleosynthetic production in all models peaks at 84Kr and 86Kr. Models B and D achieve the highest production of these isotopes, with 84Kr overproduced by a factor of ∼540 in Model B and 86Kr by a factor of ∼1300 in both models compared to solar. Nucleosynthetic production in all models extends beyond the first-peak elements, reaching species with atomic mass number A = 120. The heaviest species significantly overproduced compared to solar (by a factor of 30) in models B and E is 116Sn, while in models C and D it is 123Sb. Additionally, up to ∼6 × 10⁻⁶ M⊙ of 60Fe is produced in these same outer layers.
Finally, we performed two additional tests to study the impact of current uncertainties in the 22Ne(α,n)25Mg and 22Ne(α,γ)26Mg reaction rates. Recent re-evaluations of the 22Ne(α,n)25Mg and 22Ne(α,γ)26Mg reaction rates by different research groups have produced contradictory results (see Best et al. 2025, for a review of the latest experimental and theoretical work). For example, Wiescher et al. (2023) showed that their newly evaluated 22Ne(α,n)25Mg rate is three times higher at typical He-burning temperatures (0.2 GK < T < 0.3 GK) and a factor of two lower at temperatures around T ∼ 1 GK than the rates provided in Adsley et al. (2021). The Adsley et al. (2021) rates incorporate results from Ota et al. (2020, 2021), Jayatissa et al. (2020). Figure 11 summarises the results of our tests, showing final mass fraction abundances of 86Kr, 87Rb, 88Sr, 89Y, and 90Zr in the external layers of Model D using different 22Ne(α,n)25Mg and 22Ne(α,γ)26Mg nuclear reaction rates. Switching from the 22Ne(α,n)25Mg and 22Ne(α,γ)26Mg rates of Adsley et al. (2021) (used for all models in Table 2) to the recently re-evaluated rates of Wiescher et al. (2023) increases first-peak isotopes by factors of 2 to 4. This results in an isotopic overproduction of 86Kr compared to solar by more than a factor of 3000 and an elemental overproduction of Kr by a factor of ∼800. Interestingly, results obtained using the reaction rates from Wiescher et al. (2023) closely match those obtained by increasing the 22Ne(α,n)25Mg rate by a factor of 2.4 across all temperatures while keeping the 22Ne(α,γ)26Mg rate unchanged. This is consistent with a mean temperature of ∼4.5 × 10⁸ K during surface C-burning in Model D. At this temperature, the 22Ne(α,n)25Mg rate from Wiescher et al. (2023) differs from that of Adsley et al. (2021) by the same factor, while the respective 22Ne(α,γ)26Mg rates differ by only a few percent. Furthermore, this temperature is in agreement with an average between the peak temperature reached during C-flashes (Figure 10), where ∼70% of the trans-Fe element production occurs, and the 22Ne(α,n)25Mg activation in the interpulse period between flashes at a typical temperature of ≃3 × 10⁸ K.
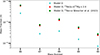 |
Fig. 11. Final mass fraction abundances of 86Kr, 87Rb, 88Sr, 89Y, and 90Zr in the external layers of Model D, employing different 22Ne(α,n)25Mg and 22Ne(α,γ)26Mg nuclear reaction rates. See main text for details. |
Table A.1 presents the mass fraction abundances of selected species shown in Figure A.1. These include the abundances in the external layers of the near-Chandrasekhar primary WD for all models listed in Table 2, along with the recomputed Model D using the 22Ne(α,n)25Mg and 22Ne(α,γ)26Mg reaction rates from Wiescher et al. (2023). These abundances can be used as pre-supernova initial conditions for explosive nucleosynthesis calculations, applicable to the outermost layers of an explodingnear-Chandrasekhar WD.
5. Explosive nucleosynthesis
This study aims to present, for the first time, the full nucleosynthesis, including trans-Fe elements, that occurs during the formation of a near-Chandrasekhar WD via the slow merger of two CO WDs. We focus primarily on the progenitor phase rather than the subsequent explosion. We will present a full grid of explosive nucleosynthesis models in a follow-up study, which will serve as the second paper in this series. In this work, we provide preliminary but qualitatively valuable results by employing a computationally lightweight 2D SNIa model to estimate the total ejected yields of trans-Fe elements synthesised during the progenitor phase.
We calculated explosive nucleosynthesis using tppnp, one of the NuGrid suite of codes described in Jones et al. (2019). The Tppnp code processes Lagrangian tracer particles from hydrodynamical simulations, assuming no mixing occurs between particles. The mixing would alter the chemical composition and thermodynamic conditions, significantly affecting nucleosynthesis. However, during a Type Ia supernova explosion, material exchange between tracer particles is not expected due to the very short timescale (less than ∼1 s) for the shock front to pass through a given particle. Additionally, Seitenzahl et al. (2010) demonstrated that 2D SNIa simulations with 322 tracer particles reproduce reference values of the most abundant nuclei (X(i) ≥ 10−5) globally at the 5 percent level, with a few exceptions, most notably isotopes of Ne, Mg, and Al. Thus, tppnp’s approach, considering a large enough number of particles and treating each one as an independent thermodynamic trajectory with a fixed initial composition and evolving temperature and density conditions, is justified. These conditions, along with the initial composition at the explosion onset, govern nuclear burning within the flame front and subsequent freeze-out.
We used the 1.4 M⊙ model of Townsley et al. (2016) (hereafter T16), including reconstructed flame fronts, as our baseline model. We carried out calculations using the method described in Keegans et al. (2023). In the T16 model, explosive nuclear combustion of the degenerate carbon–oxygen mixture proceeds through both deflagration and detonation combustion modes combined into the deflagration–detonation transition (DDT) scenario (Khokhlov 1991). We selected a total of 7856 tracer particles for post-processing nucleosynthesis calculations in the T16 model. Convergence studies on non-reconstructed flame fronts demonstrate that this number of particles is sufficient for converged abundances (Keegans et al. 2023) and is fully adequate for the scope of this first paper. The T16 model achieves a very high resolution in the hotter regions of the explosion;however, the resolution in the outer layers of the WD is lower than, for example, in Travaglio et al. (2011). Therefore, there may be some loss of accuracy in the outer layers, where most trans-Fe element yields originate. Multidimensional models, including ≥5 × 10⁵ particles and highly resolved external layers, will be considered in the second paper in this series. As detailed in T16, the explosion in the WD progenitor is initiated by introducing an artificial hot spot at a predetermined radius, where the temperature is raised to 10 GK. Heat diffuses from this region, igniting the flame in the C−O material.
Our nuclear reaction network for explosive nucleosynthesis simulations consists of more than 5200 isotopes and 75 000 reactions. We sourced reaction rates from a variety of compilations. The majority of reactions, excluding weak reactions, were taken from Rauscher & Thielemann (2000) (Basel REACLIB), Cyburt et al. (2010) (JINA REACLIB), Dillmann et al. (2006) (KADoNIS), Angulo et al. (1999) (NACRE), Caughlan & Fowler (1988), and Iliadis et al. (2001). Weak reaction rates were compiled from Fuller et al. (1985), Oda et al. (1994), Goriely (1999), and Langanke & Martínez-Pinedo (2000), as well as from Takahashi & Yokoi (1987), as discussed in Jones et al. (2019) and Pignatari et al. (2016).
Table 4 presents the elemental ejected yields beyond Fe-peak elements and up to Ba from our near-Chandrasekhar explosive model. We computed the ejected yields in the third column using the initial abundances adopted at the onset of the explosion from our progenitor Model D, with the pre-supernova nucleosynthesis calculated using the 22Ne(α,n)25Mg and 22Ne(α,γ)26Mg reaction rates from Wiescher et al. (2023). Specifically, we used abundances from the corresponding column of Table A.1 within the outermost 0.11 M⊙ layers of our explosive model. To assess the effect of pre-explosive trans-Fe production, the fourth column shows final yields from the same explosive model without trans-Fe element enrichment in the outer layers of the primary WD and with a 22Ne abundance equal to the accreted value for model D (see Table 1). The element ejected in the highest amount is Kr (6.66 × 10⁻⁶ M⊙). During the explosion, (γ,n) and (n,γ) reactions slightly modify the total abundances produced in the progenitor phase (see also Arnould 1976; Travaglio et al. 2011; Roberti et al. 2023). The total ejected amount of all first-peak elements decreases by ∼30% compared to pre-supernova nucleosynthesis. The only exception is Sr, whose abundance increases by ∼17% in the explosive ejecta. Most importantly, Kr, Rb, and Sr are ejected in significant amounts (≥10−6 M⊙) during the explosion. These are comparable to those reported by Watson et al. (2019), who detected ∼10−5 M⊙ of Sr from near-IR and partly near-UV lines in the AT2017gfo kilonova spectra (see their Fig. 4). This suggests that the identification of trans-Fe elements, formed exclusively during the progenitor phase under near-Chandrasekhar conditions, is feasible and could potentially serve as a novel ‘smoking gun’ for distinguishing near-Chandrasekhar explosions from sub-Chandrasekhar ones. However, as noted, these encouraging results require confirmation from a grid of higher-resolution SNIa models, which will be presented in a follow-up study.
Ejected yields in M⊙ of trans-Fe elements from the T16 explosion model, adopting our final pre-explosive surface trans-Fe abundances as initial abundances.
Finally, we report a total ejected 60Fe mass of ∼4.6 × 10⁻⁷ M⊙. This corresponds to an approximate 20-fold increase in 60Fe yields compared to those from the same explosive model without trans-Fe element enrichment in the external layers of the primary WD. This increase may affect theoretical mass estimates of 60Fe in the Milky Way, depending on the rate of near-Chandrasekhar explosions, since SNIa are generally considered negligible contributors to 60Fe in the Galaxy (Vasini et al. 2022). Additionally, this could be a promising case for next-generation γ-ray telescopes, which will possess the sensitivity to directly detect a single supernova remnant (Scharrer et al. 2025).
6. Conclusions
We calculated the evolution and nucleosynthesis of slowly merging CO WDs using the stellar code MESA. We present a grid of five models detailing the evolution and nucleosynthesis of slowly merging CO WDs approaching the Chandrasekhar mass. Our main results and final remarks can be summarised as follows.
-
As our models approach the Chandrasekhar mass during the merger phase, carbon-burning ignites on the surface before it ignites in the centre. Stellar plasma becomes enriched in α-particles released via the 12C(12C,α)20Ne reaction. These α-particles are then captured by 22Ne and converted into neutrons via the 22Ne(α,n)25Mg reaction in the external layers of the primary WD.
-
The resulting neutron-capture seed distribution closely resembles a weak s-process pattern and peaks at Kr, which is overproduced by a factor of ∼800 compared to solar. Specific isotopes, particularly 86Kr, are overproduced by more than a factor of 3000. Current uncertainties in the 22Ne(α,n)25Mg and 22Ne(α,γ)26Mg reaction rates affect these results by about a factor of 2. The 22Ne(α,n)25Mg and 22Ne(α,γ)26Mg nuclear reaction rates tested here are available in tabulated format from the open-source platform ChANUREPS (ChETEC AstroNUclear REPositorieS2).
-
The mass of the outermost layers enriched in first-peak s-process elements strongly depends on the accretion rate onto the primary WD and ranges between ∼0.04 M⊙ and ∼0.11 M⊙.
-
We computed nucleosynthesis arising from the explosion of a near-Chandrasekhar explosion model using the final abundances from our progenitors as initial conditions. During the explosion, Ga, Ge, Se, Kr, Rb, and Sr are all ejected in high amounts (> 10−6 M⊙). Previous work (Battino et al. 2020), shows that a similar nucleosynthesis process during the progenitor phase may also occur on the surface of near-Chandrasekhar WDs formed through the accretion of H-rich material via the single-degenerate scenario.
-
These ejected abundances are comparable to those reported by Watson et al. (2019), who successfully detected ∼10−5 M⊙ of Sr from near-IR and partially near-UV lines of the AT2017gfo kilonova spectra. This suggests that spectral identification of trans-Fe elements in SNIa is feasible and could constitute a novel spectroscopically observable ‘smoking gun’ for near-Chandrasekhar progenitors. To our knowledge, the synthesis of trans-Fe elements during the SNIa progenitor phase is only possible if the exploding WD has a mass close to the Chandrasekhar limit. These encouraging findings require confirmation by a grid of more highly resolved SNIa models, which we will present in a follow-up study.
-
Conversely, non-detection of trans-Fe elements in SN ejecta does not necessarily imply that the explosion originated from a sub-Chandrasekhar progenitor. For example, an accretion rate < 2 × 10⁻⁶ M⊙ would produce a Chandrasekhar-mass primary WD without igniting C on the surface, and therefore without producing trans-Fe elements. Consequently, the fraction of nearby SNIa showing a trans-Fe element signature in their ejecta could instead provide a robust lower limit on the near-Chandrasekhar fraction of the total SNIa population.
-
The only sub-Chandrasekhar progenitor scenario possibly allowing trans-Fe element production while also predicting light curves and spectra consistent with those of normal SNIa is the accretion of He-rich matter onto a massive CO WD, provided that the CO core is sufficiently massive (≥1 M⊙) and the He buffer is small enough (≤0.05 M⊙). Otherwise, a low-luminosity and peculiar nucleosynthesis event will result (Woosley & Kasen 2011). In this scenario, trans-Fe nucleosynthesis may occur if a specific variable accretion rate is realised, consisting of an initial high accretion rate (∼10−6 M⊙ yr−1) that ensures steady accretion of the primary CO WD beyond ∼1 M⊙, followed by a lower accretion rate phase (∼10−7 M⊙ yr−1) sustained long enough to allow the development of strong He flashes and activation of the 22Ne(α,n)25Mg reaction, and finally a very low accretion rate phase (∼10−8 M⊙ yr−1) that triggers the final detonation (Piersanti et al. 2014). While the simultaneous fulfilment of all these conditions may challenge the efficiency of this scenario, it still represents an unexplored case in terms of the resulting nucleosynthesis. Addressing this is essential for developing a comprehensive understanding of all scenarios capable of producing a trans-Fe spectroscopic signature and will be the main goal of a future work in this series.
-
Finally, we report a total ejected 60Fe mass of ∼4.6 × 10⁻⁷ M⊙. This corresponds to an approximately 20-fold increase in 60Fe yields compared to those obtained from the same explosive model without trans-Fe element enrichment in the external layers of the primary WD. Depending on the rate of near-Chandrasekhar explosions, this increase could affect theoretical 60Fe mass estimates in the Milky Way. Moreover, this presents a promising case for next-generation γ-ray telescopes, which will possess the sensitivity to directly detect a single supernova remnant.
Validating these predictions relies heavily on upcoming large observational surveys, such as the Time-Domain Extragalactic Survey (TiDES). This survey will spectroscopically follow up transients detected by the Vera Rubin Observatory Legacy Survey of Space and Time (VRO-LSST) survey and will observe spectra of over 30 000 supernovae, many of which will be SNIa. This strongly motivates the computation of a full grid of highly resolved multidimensional explosion simulations incorporating trans-Fe enrichment from our progenitor models, currently underway and to be published in a follow-up study. This effort will ultimately enable computation of synthetic observables of trans-Fe elements in SNIa ejecta, facilitating the search for their spectroscopic signatures in SNIa emissions.
Notice that this introduces an inconsistency with the primary WD originating from a Z = 0.02 progenitor. This might influence the C and O profiles in the deep WD interior, potentially impacting the explosion conditions. However, this does not affect the results of the present work, which is mainly focused on the trans-Fe element production occurring in the outermost ∼0.1 M⊙ when the WD mass has reached a near-Chandrasekhar value. As a consequence, this production depends solely on the accreted composition and not on the central conditions.
Acknowledgments
This article is based upon work from the ChETEC COST Action (CA16117). UB acknowledges support by ChETEC-INFRA (EU project no. 101008324), JINA-CEE (NSF Grant PHY-1430152), the European Research Council (ERC-2019-STG Nr. 852016) and the Italian Ministry of Research (FARE project EASγ R20SLAA8CJ). This research was enabled in part by support provided by the BC DRI Group, the Digital Research Alliance of Canada (alliancecan.ca) and ongoing access to viper, the University of Hull High Performance Computing Facility. We thank the IReNA network supported by US NSF AccelNet. We acknowledge the EuroHPC Joint Undertaking for awarding this project access to the EuroHPC supercomputer LUMI, hosted by CSC (Finland) and the LUMI consortium through a EuroHPC Benchmark Access call (proposal ID: 465000917). The work of FKR is supported by the Klaus Tschira Foundation, by the Deutsche Forschungsgemeinschaft (DFG, German Research Foundation) – RO 3676/7-1, project number 537700965, and by the European Union (ERC, ExCEED, project number 101096243). Views and opinions expressed are, however, those of the authors only and do not necessarily reflect those of the European Union or the European Research Council Executive Agency. Neither the European Union nor the granting authority can be held responsible for them. This work benefited from discussions and resources provided by the STFC-funded BRIDGCE UK Network (https://www.bridgce.ac.uk/). SAS acknowledges funding from STFC grant ST/X00094X/1.
References
- Adsley, P., Battino, U., Best, A., et al. 2021, Phys. Rev. C, 103, 015805 [CrossRef] [Google Scholar]
- Angulo, C., Arnould, M., Rayet, M., et al. 1999, Nucl. Phys. A, 656, 3 [Google Scholar]
- Arnould, M. 1976, A&A, 46, 117 [Google Scholar]
- Arnould, M., & Goriely, S. 2003, Phys. Rep., 384, 1 [Google Scholar]
- Battino, U., Pignatari, M., Travaglio, C., et al. 2020, MNRAS, 497, 4981 [CrossRef] [Google Scholar]
- Battino, U., Lederer-Woods, C., Travaglio, C., Röpke, F. K., & Gibson, B. 2022, Eur. Phys. J. Web Conf., 260, 06002 [Google Scholar]
- Best, A., Adsley, P., Amberger, R., et al. 2025, Eur. Phys. J. A, 61, 99 [Google Scholar]
- Böhm-Vitense, E. 1958, Z. Astrophys., 46, 108 [Google Scholar]
- Boos, S. J., Townsley, D. M., & Shen, K. J. 2024, ApJ, 972, 200 [NASA ADS] [CrossRef] [Google Scholar]
- Breedt, E., Steeghs, D., Marsh, T. R., et al. 2017, MNRAS, 468, 2910 [NASA ADS] [CrossRef] [Google Scholar]
- Burbidge, E. M., Burbidge, G. R., Fowler, W. A., & Hoyle, F. 1957, Rev. Mod. Phys., 29, 547 [NASA ADS] [CrossRef] [Google Scholar]
- Cameron, A. G. W. 1957, PASP, 69, 201 [NASA ADS] [CrossRef] [Google Scholar]
- Cassisi, S., Potekhin, A. Y., Pietrinferni, A., Catelan, M., & Salaris, M. 2007, ApJ, 661, 1094 [NASA ADS] [CrossRef] [Google Scholar]
- Caughlan, G. R., & Fowler, W. A. 1988, At. Data Nucl. Data Tab., 40, 283 [NASA ADS] [CrossRef] [Google Scholar]
- Cheng, S., Cummings, J. D., Ménard, B., & Toonen, S. 2020, ApJ, 891, 160 [CrossRef] [Google Scholar]
- Cyburt, R. H., Amthor, A. M., Ferguson, R., et al. 2010, ApJS, 189, 240 [NASA ADS] [CrossRef] [Google Scholar]
- Denissenkov, P. A., Herwig, F., Truran, J. W., & Paxton, B. 2013, ApJ, 772, 37 [NASA ADS] [CrossRef] [Google Scholar]
- Denissenkov, P. A., Truran, J. W., Pignatari, M., et al. 2014, MNRAS, 442, 2058 [NASA ADS] [CrossRef] [Google Scholar]
- Denissenkov, P. A., Herwig, F., Battino, U., et al. 2017, ApJ, 834, L10 [Google Scholar]
- Dillmann, I., Heil, M., Käppeler, F., et al. 2006, AIP Conf. Ser., 819, 123 [NASA ADS] [CrossRef] [Google Scholar]
- Fuller, G. M., Fowler, W. A., & Newman, M. J. 1985, ApJ, 293, 1 [NASA ADS] [CrossRef] [Google Scholar]
- Gasques, L. R., Afanasjev, A. V., Aguilera, E. F., et al. 2005, Phys. Rev. C, 72, 025806 [NASA ADS] [CrossRef] [Google Scholar]
- Goriely, S. 1999, A&A, 342, 881 [NASA ADS] [Google Scholar]
- Gronow, S., Côté, B., Lach, F., et al. 2021, A&A, 656, A94 [NASA ADS] [CrossRef] [EDP Sciences] [Google Scholar]
- Harris, H. C., Munn, J. A., Kilic, M., et al. 2006, AJ, 131, 571 [NASA ADS] [CrossRef] [Google Scholar]
- Herwig, F. 2000, A&A, 360, 952 [NASA ADS] [Google Scholar]
- Herwig, F. 2005, ARA&A, 43, 435 [NASA ADS] [CrossRef] [Google Scholar]
- Herwig, F., Freytag, B., Fuchs, T., et al. 2007, ASP Conf. Ser., 378, 43 [Google Scholar]
- Hubbard, W. B., & Lampe, M. 1969, ApJS, 18, 297 [NASA ADS] [CrossRef] [Google Scholar]
- Iben, I., Jr. 1975, ApJ, 196, 525 [NASA ADS] [CrossRef] [Google Scholar]
- Iben, I., Jr. 1984, ApJ, 277, 333 [Google Scholar]
- Iben, I., Jr., & Renzini, A. 1983, ARA&A, 21, 271 [NASA ADS] [CrossRef] [Google Scholar]
- Iglesias, C. A., & Rogers, F. J. 1996, ApJ, 464, 943 [NASA ADS] [CrossRef] [Google Scholar]
- Iliadis, C., D’Auria, J. M., Starrfield, S., Thompson, W. J., & Wiescher, M. 2001, ApJS, 134, 151 [NASA ADS] [CrossRef] [Google Scholar]
- Jayatissa, H., Rogachev, G., Goldberg, V., et al. 2020, Phys. Lett. B, 802, 135267 [CrossRef] [Google Scholar]
- Johansson, J., Woods, T. E., Gilfanov, M., et al. 2016, MNRAS, 461, 4505 [Google Scholar]
- Jones, S. W., Möller, H., Fryer, C. L., et al. 2019, MNRAS, 485, 4287 [NASA ADS] [CrossRef] [Google Scholar]
- Keegans, J. D., Pignatari, M., Stancliffe, R. J., et al. 2023, ApJS, 268, 8 [NASA ADS] [CrossRef] [Google Scholar]
- Khokhlov, A. M. 1991, A&A, 245, 114 [NASA ADS] [Google Scholar]
- Kobayashi, C., Karakas, A. I., & Lugaro, M. 2020, ApJ, 900, 179 [Google Scholar]
- Kunz, R., Fey, M., Jaeger, M., et al. 2002, ApJ, 567, 643 [CrossRef] [Google Scholar]
- Lach, F., Röpke, F. K., Seitenzahl, I. R., et al. 2020, A&A, 644, A118 [NASA ADS] [CrossRef] [EDP Sciences] [Google Scholar]
- Langanke, K., & Martínez-Pinedo, G. 2000, Nucl. Phys. A, 673, 481 [NASA ADS] [CrossRef] [Google Scholar]
- Li, W., Chornock, R., Leaman, J., et al. 2011, MNRAS, 412, 1473 [NASA ADS] [CrossRef] [Google Scholar]
- Livne, E. 1990, ApJ, 354, L53 [Google Scholar]
- Lorén-Aguilar, P., Isern, J., & García-Berro, E. 2009, A&A, 500, 1193 [NASA ADS] [CrossRef] [EDP Sciences] [Google Scholar]
- Matteucci, F., & Greggio, L. 1986, A&A, 154, 279 [NASA ADS] [Google Scholar]
- Moe, M., & Di Stefano, R. 2017, ApJS, 230, 15 [Google Scholar]
- Nomoto, K., Saio, H., Kato, M., & Hachisu, I. 2007, ApJ, 663, 1269 [Google Scholar]
- O’Brien, M. W., Tremblay, P. E., Klein, B. L., et al. 2024, MNRAS, 527, 8687 [Google Scholar]
- Oda, T., Hino, M., Muto, K., Takahara, M., & Sato, K. 1994, At. Data Nucl. Data Tab., 56, 231 [NASA ADS] [CrossRef] [Google Scholar]
- Ota, S., Christian, G., Lotay, G., et al. 2020, Phys. Lett. B, 802, 135256 [CrossRef] [Google Scholar]
- Ota, S., Christian, G., Catford, W. N., et al. 2021, Phys. Rev. C, 104, 055806 [Google Scholar]
- Pakmor, R., Hachinger, S., Röpke, F. K., & Hillebrandt, W. 2011, A&A, 528, A117 [NASA ADS] [CrossRef] [EDP Sciences] [Google Scholar]
- Pakmor, R., Kromer, M., Taubenberger, S., et al. 2012, ApJ, 747, L10 [NASA ADS] [CrossRef] [Google Scholar]
- Pakmor, R., Kromer, M., Taubenberger, S., & Springel, V. 2013, ApJ, 770, L8 [Google Scholar]
- Pakmor, R., Callan, F. P., Collins, C. E., et al. 2022, MNRAS, 517, 5260 [NASA ADS] [CrossRef] [Google Scholar]
- Piersanti, L., Gagliardi, S., Iben, I., Jr., & Tornambé, A. 2003a, ApJ, 598, 1229 [CrossRef] [Google Scholar]
- Piersanti, L., Gagliardi, S., Iben, I., Jr., & Tornambé, A. 2003b, ApJ, 583, 885 [Google Scholar]
- Piersanti, L., Tornambé, A., & Yungelson, L. R. 2014, MNRAS, 445, 3239 [NASA ADS] [CrossRef] [Google Scholar]
- Pignatari, M., Herwig, F., Hirschi, R., et al. 2016, ApJS, 225, 24 [NASA ADS] [CrossRef] [Google Scholar]
- Rauscher, T., & Thielemann, F.-K. 2000, At. Data Nucl. Data Tab., 75, 1 [Google Scholar]
- Ritter, C., Herwig, F., Jones, S., et al. 2018, MNRAS, 480, 538 [NASA ADS] [CrossRef] [Google Scholar]
- Roberti, L., Pignatari, M., Psaltis, A., et al. 2023, A&A, 677, A22 [NASA ADS] [CrossRef] [EDP Sciences] [Google Scholar]
- Saio, H., & Nomoto, K. 2004, ApJ, 615, 444 [NASA ADS] [CrossRef] [Google Scholar]
- Scharrer, N., Spencer, S. T., Joshi, V., & Mitchell, A. M. W. 2025, JCAP, 2025, 096 [Google Scholar]
- Seitenzahl, I. R., Röpke, F. K., Fink, M., & Pakmor, R. 2010, MNRAS, 407, 2297 [NASA ADS] [CrossRef] [Google Scholar]
- Shen, K. J., Boos, S. J., & Townsley, D. M. 2024, ApJ, 975, 127 [NASA ADS] [CrossRef] [Google Scholar]
- Siess, L. 2006, A&A, 448, 717 [NASA ADS] [CrossRef] [EDP Sciences] [Google Scholar]
- Takahashi, K., & Yokoi, K. 1987, At. Data Nucl. Data Tab., 36, 375 [Google Scholar]
- Timmes, F. X., Woosley, S. E., & Taam, R. E. 1994, ApJ, 420, 348 [NASA ADS] [CrossRef] [Google Scholar]
- Toonen, S., Nelemans, G., & Portegies Zwart, S. 2012, A&A, 546, A70 [NASA ADS] [CrossRef] [EDP Sciences] [Google Scholar]
- Townsley, D. M., Miles, B. J., Timmes, F., Calder, A. C., & Brown, E. F. 2016, ApJS, 225, 3 [Google Scholar]
- Travaglio, C., Röpke, F. K., Gallino, R., & Hillebrandt, W. 2011, ApJ, 739, 93 [NASA ADS] [CrossRef] [Google Scholar]
- Travaglio, C., Gallino, R., Rauscher, T., Röpke, F. K., & Hillebrandt, W. 2015, ApJ, 799, 54 [Google Scholar]
- Trueman, T. C. L., Pignatari, M., Cseh, B., et al. 2025, A&A, 696, A164 [NASA ADS] [CrossRef] [EDP Sciences] [Google Scholar]
- Vasini, A., Matteucci, F., & Spitoni, E. 2022, MNRAS, 517, 4256 [NASA ADS] [CrossRef] [Google Scholar]
- Watson, D., Hansen, C. J., Selsing, J., et al. 2019, Nature, 574, 497 [NASA ADS] [CrossRef] [Google Scholar]
- Whelan, J., & Iben, I., Jr. 1973, ApJ, 186, 1007 [Google Scholar]
- Wiescher, M., DeBoer, R. J., & Görres, J. 2023, Eur. Phys. J. A, 59, 11 [Google Scholar]
- Woosley, S. E., & Kasen, D. 2011, ApJ, 734, 38 [Google Scholar]
- Woosley, S. E., & Weaver, T. A. 1994, ApJ, 423, 371 [Google Scholar]
- Woosley, S. E., Wunsch, S., & Kuhlen, M. 2004, ApJ, 607, 921 [NASA ADS] [CrossRef] [Google Scholar]
- Wu, C., Wang, B., & Liu, D. 2019, MNRAS, 483, 263 [CrossRef] [Google Scholar]
- Yakovlev, D. G., & Urpin, V. A. 1980, Soviet Astron., 24, 303 [Google Scholar]
- Yoon, S. C., & Langer, N. 2005, A&A, 435, 967 [NASA ADS] [CrossRef] [EDP Sciences] [Google Scholar]
Appendix A: Additional material
Pre-supernova abundances in mass fraction of selected species among those presented in Fig. A.1.
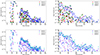 |
Fig. A.1. Final abundance distribution in the external layers of the near-Chandrasekhar primary WD for the models listed in table 2. All abundances have been extracted at the same mass coordinate, Mr = 1.35 M⊙, which is representative of trans-Fe element production in all models. For all models, we present both the distribution over the whole atomic mass range and a zoom in the species beyond Fe (A= 56). |
All Tables
Chemical composition mass fractions of the accreted material from the secondary WD used in this work.
Main settings adopted in the grid of SNIa progenitor models presented in this work.
Mean neutron densities during surface C-burning, duration of the 1st C-flash, and total number of surface C-flashes for all models presented in this work.
Ejected yields in M⊙ of trans-Fe elements from the T16 explosion model, adopting our final pre-explosive surface trans-Fe abundances as initial abundances.
Pre-supernova abundances in mass fraction of selected species among those presented in Fig. A.1.
All Figures
|
Fig. 1. Hertzsprung–Russell diagrams of the models listed in Table 1. The evolution starts at the bottom-right end of the tracks. |
| In the text | |
|
Fig. 2. Kippenhahn diagrams of models C (top panel) and D (bottom panel). |
| In the text | |
|
Fig. 3. Temperature and density profiles of models C (top panel) and D (bottom panel) at different moments during the mass accretion. |
| In the text | |
|
Fig. 4. Kippenhahn diagram of the first surface C-flash and related propagation of C-flames in models B (top panel) and C (bottom panel). The x axis shows the time from the onset of surface C-burning. |
| In the text | |
|
Fig. 5. Temperature, density, and convective velocity profiles of Model C at different times during the development of the first surface C-burning episode. Lines of the same colour correspond to the same simulation time step. The convective region induced by C-burning is tightly bound to the location of the temperature peak, which corresponds to the location of the inward-propagating burning front. |
| In the text | |
|
Fig. 6. Temperature, 20Ne, and 12C mass fraction profiles as functions of the Lagrangian mass coordinate shown in the vicinity of the base of the C-flame convective zone in Model C. The dark and light green shaded areas represent stellar regions dominated by convection and convective boundary mixing, respectively. Across the latter, convective velocities decrease by a factor of 1000. |
| In the text | |
|
Fig. 7. Typical mass zoning in the region of the temperature peak within the C-flame front in our simulations. |
| In the text | |
|
Fig. 8. Trans-Fe element abundance profile in the external layers of the near-Chandrasekhar primary WD for models listed in Table 2. Models from A to E are shown from top to bottom. |
| In the text | |
|
Fig. 9. Kippenhahn diagram of surface structure evolution and the development of five C-flashes episodes in Model D. The time coordinate on the x axis is expressed in computational time steps to ensure a proper graphical resolution of the C-flash-driven convective zones. |
| In the text | |
|
Fig. 10. Key species and temperature profiles at the onset of two of the five C-flashes in Model D shown in Figure 9. |
| In the text | |
|
Fig. 11. Final mass fraction abundances of 86Kr, 87Rb, 88Sr, 89Y, and 90Zr in the external layers of Model D, employing different 22Ne(α,n)25Mg and 22Ne(α,γ)26Mg nuclear reaction rates. See main text for details. |
| In the text | |
|
Fig. A.1. Final abundance distribution in the external layers of the near-Chandrasekhar primary WD for the models listed in table 2. All abundances have been extracted at the same mass coordinate, Mr = 1.35 M⊙, which is representative of trans-Fe element production in all models. For all models, we present both the distribution over the whole atomic mass range and a zoom in the species beyond Fe (A= 56). |
| In the text | |
Current usage metrics show cumulative count of Article Views (full-text article views including HTML views, PDF and ePub downloads, according to the available data) and Abstracts Views on Vision4Press platform.
Data correspond to usage on the plateform after 2015. The current usage metrics is available 48-96 hours after online publication and is updated daily on week days.
Initial download of the metrics may take a while.