Fig. 4.
Download original image
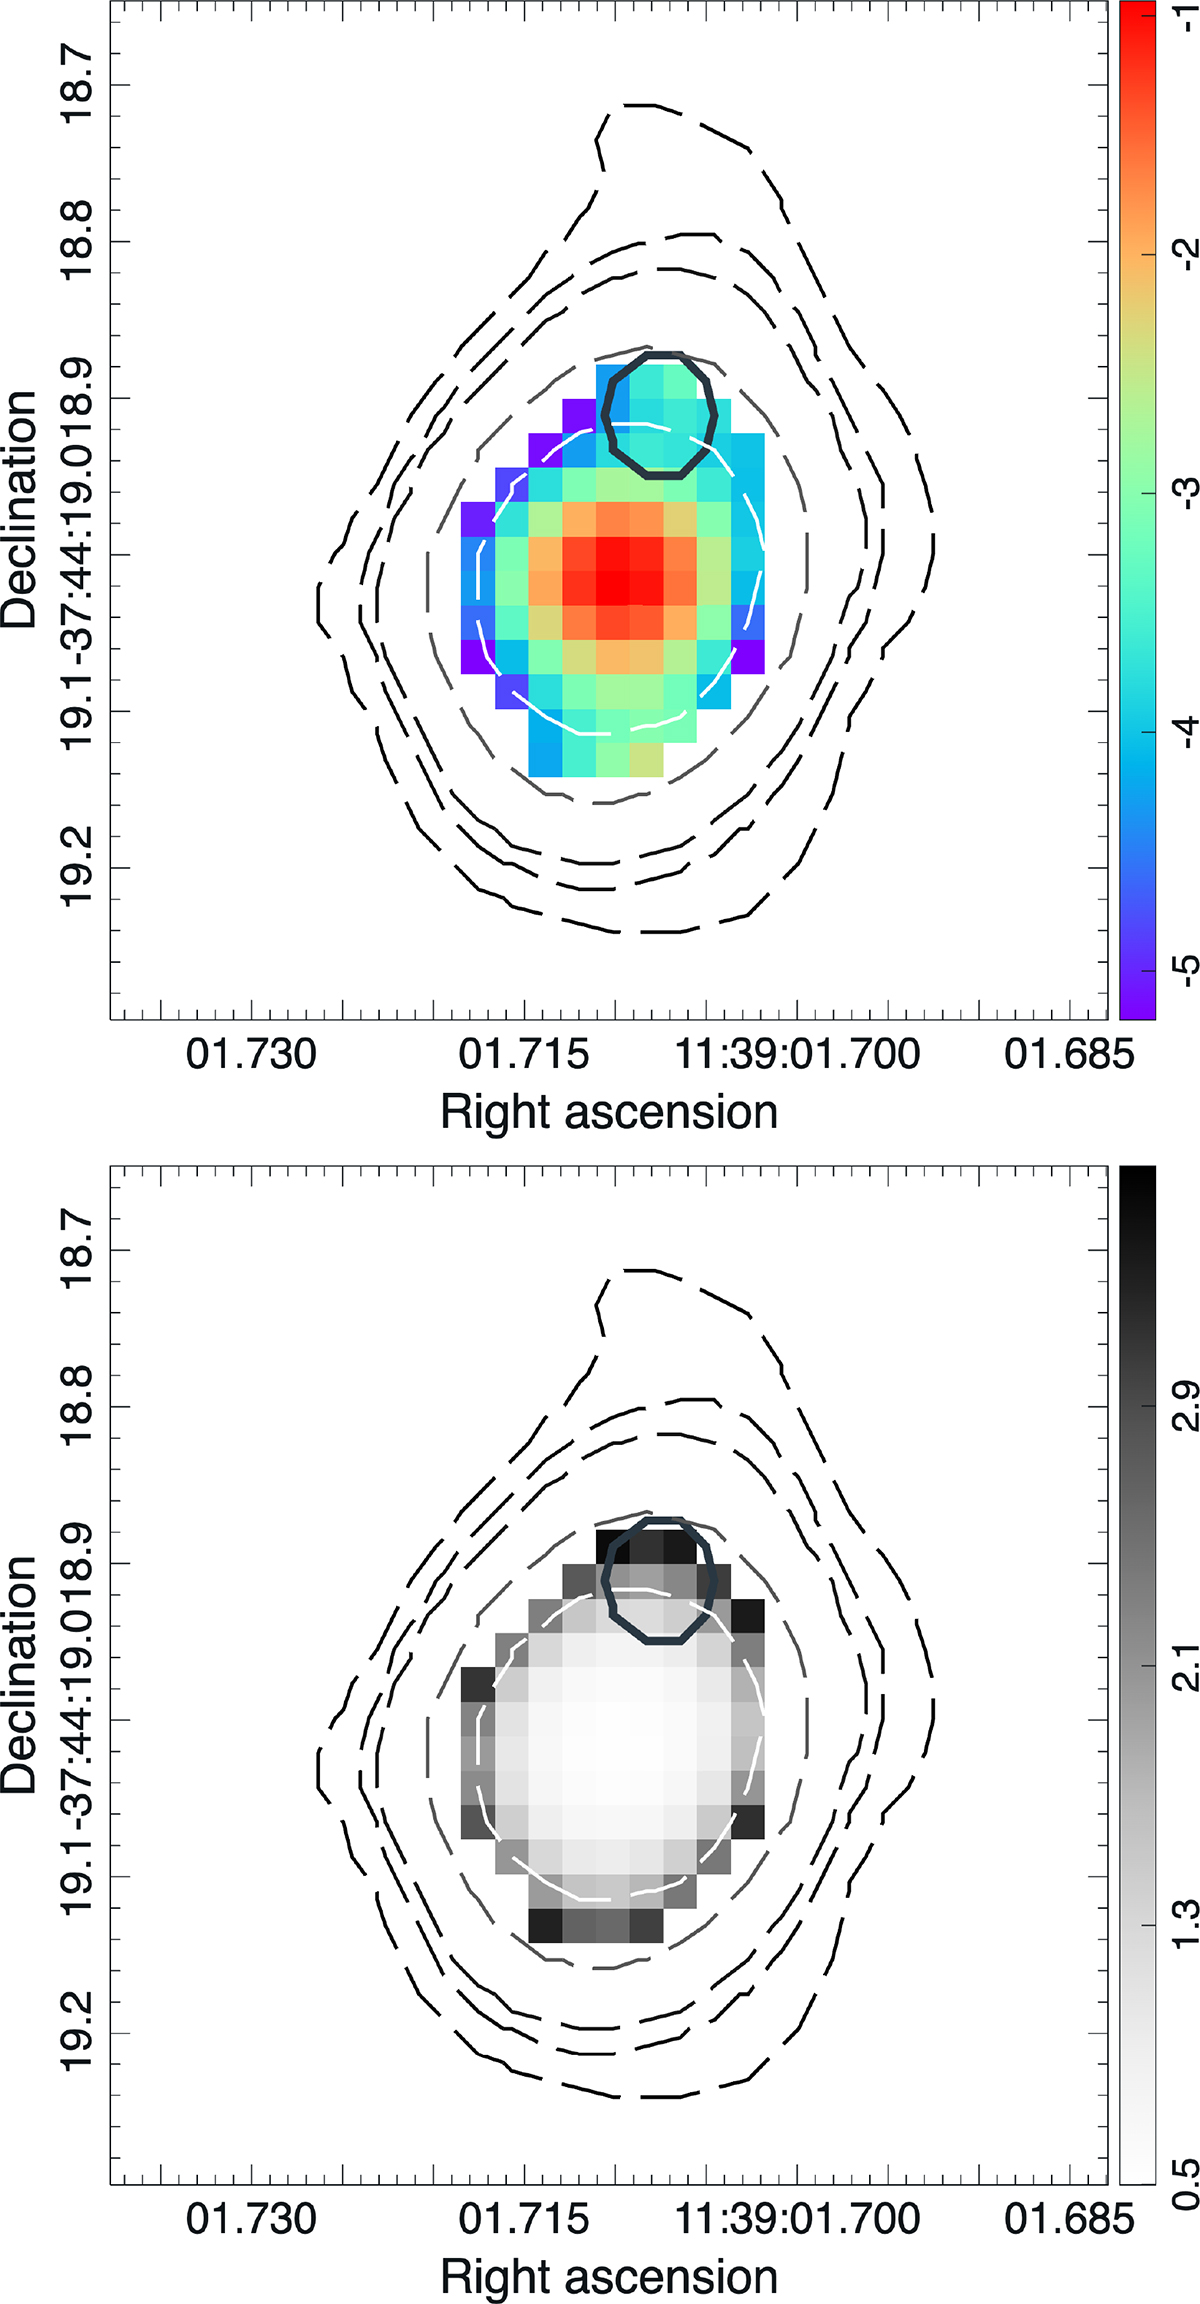
Map of the in-band spectral index α (upper panel) and its associated error (bottom panel) of NGC 3783. Dashed contours represent the total intensity (see Fig. 1). The position of the polarized source is highlighted by a thick black contour. Note that the very steep slope in the outer regions is likely an artifact caused by the slightly narrower beam size at higher frequencies.
Current usage metrics show cumulative count of Article Views (full-text article views including HTML views, PDF and ePub downloads, according to the available data) and Abstracts Views on Vision4Press platform.
Data correspond to usage on the plateform after 2015. The current usage metrics is available 48-96 hours after online publication and is updated daily on week days.
Initial download of the metrics may take a while.